- Search Crypto Craft
- 25 Results
-
 236dave replied Jan 4, 2017
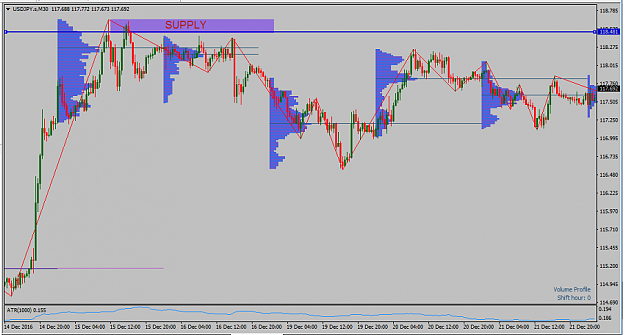
Hi Trader Dale, Happy New Year, and thanks for the levels. Can you answer a question so I can try to understand how you got the USDJPY short of 118.48. Was this based on a supply zone from December 15th? I can't see any high volume nodes for this ...
Trader Dale - daily trading levels
- 236dave replied Apr 29, 2015
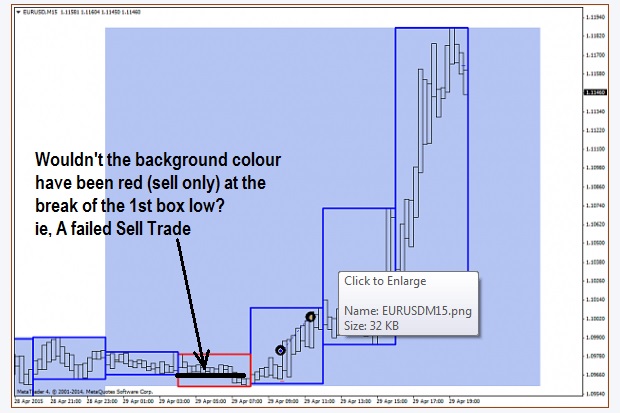
Hi easytrading3, I am trying to understand the system from your examples. If I can clear some doubts that I have I would consider buying from you. Its already been said that the background colour of the large box can change as prices go up or down, ...
FX Incognito: (open, high, low, close) is ALL you need!
- 236dave replied Sep 22, 2014
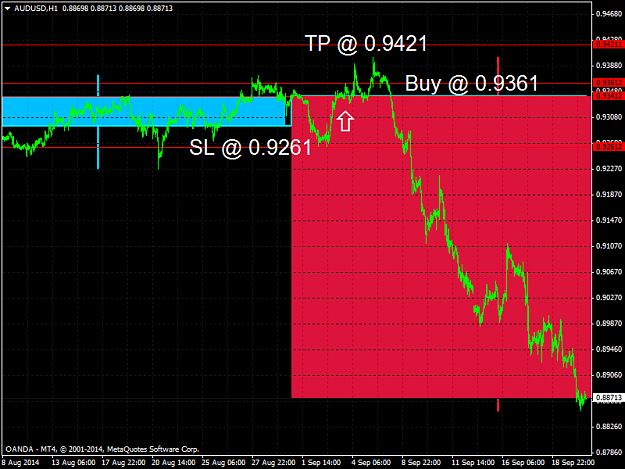
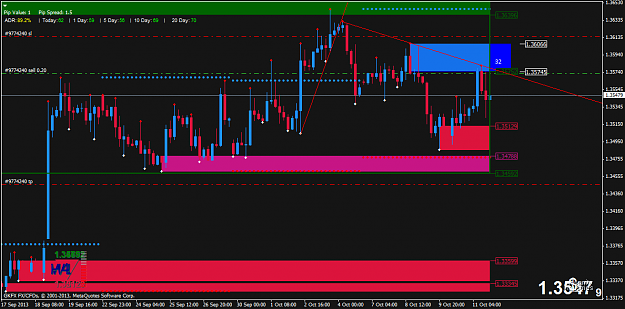
Hi Rob, I am using Oanda which must have a different GMT Offset to explain the difference. I would expect results would even out over time. See my AUDUSD chart below: image Dave
Follow the monthly candle and be profitable
- 236dave replied Sep 22, 2014
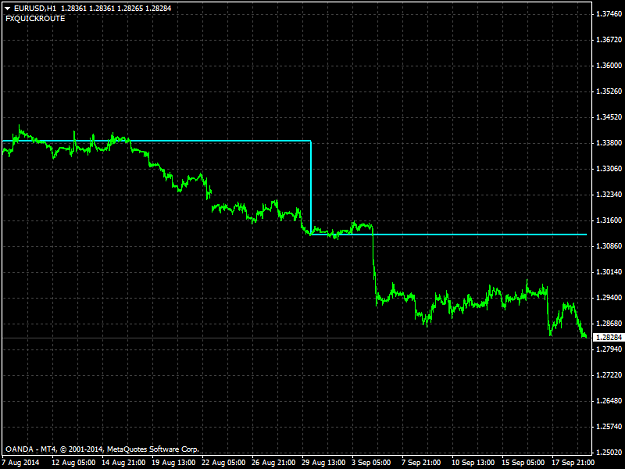
On my chart the March monthly candle was up (blue). I think the reason for the discrepancy, was there was a weekend gap between the end of Feb and beginning of March. ie, the market gapped down over the weekend, but March ended higher than its open ...
Follow the monthly candle and be profitable
- 236dave replied Sep 21, 2014
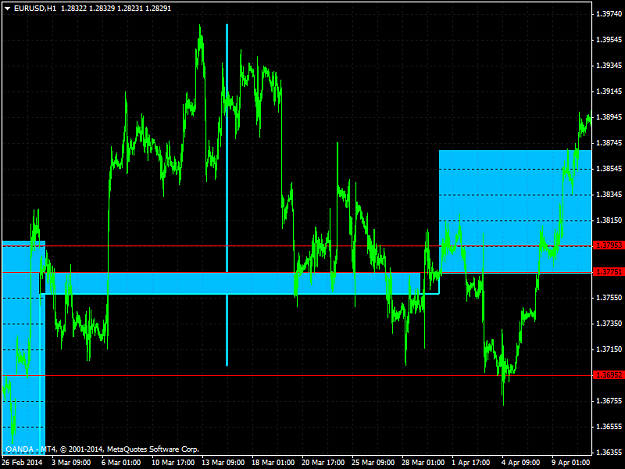
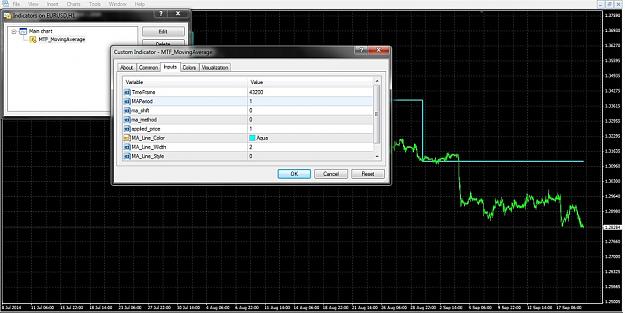
Hi All, Here is a mtf ma indicator which may help people. With the shown settings you can see the monthly open line relative to the previous months. image image file file Dave
Follow the monthly candle and be profitable
- 236dave replied Sep 3, 2014
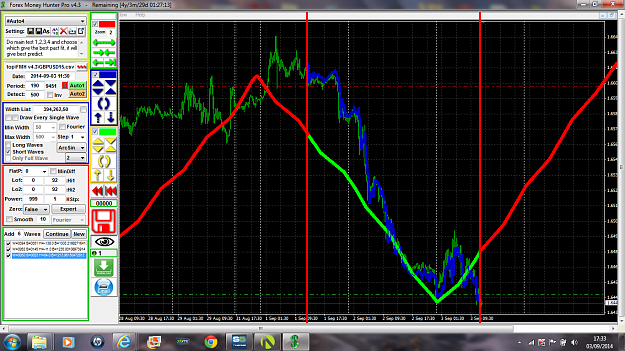
Hi Remon, Your software has caught my interest, thanks for sharing. Is it giving profitable results whilst using decent risk to reward ratio? ie at least R1:1 Can it be backtested? It appears to predict a rise in price on the attached GBPUSDM15 ...
Every Day, We Will Know Tomorrow's Prices!!
- 236dave replied May 13, 2014
Hi All, I have SC running with Stage 5 data feed and with the help of another SC user I have been able to setup charts as per attached. My objective is to try and learn whilst following the signals, although with recent developments in my day job I ...
Surfing Risk Intraday - Volume Profile and Order flow
![Click to Enlarge
Name: ESM4 [CBV] 120 Min #2 41772.677.png
Size: 50 KB](/attachment/image/1425894/thumbnail?d=1399997926)
![Click to Enlarge
Name: ESM14 ESM4 [CBV] Daily #3 41772.677.png
Size: 41 KB](/attachment/image/1425896/thumbnail?d=1399997961)
- 236dave replied Apr 15, 2014
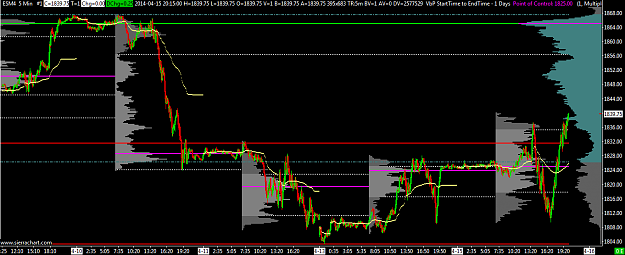
Hi RS, Made the recommended changes and here is how the ES looks now, ie, reduced sensitivity on peaks and valley's and now using 24 hour data: Are there anymore improvements that you could recommend? Thanks Dave
Surfing Risk Intraday - Volume Profile and Order flow
![Click to Enlarge
Name: ESM4 [CBV] 120 Min revised.png
Size: 49 KB](/attachment/image/1407810/thumbnail?d=1397594160)
![Click to Enlarge
Name: ESM4 [CBV] Daily revised.png
Size: 40 KB](/attachment/image/1407811/thumbnail?d=1397594177)
- 236dave replied Apr 14, 2014
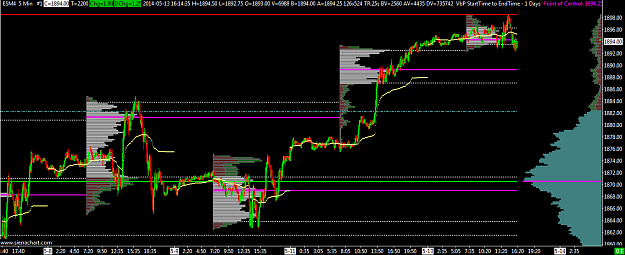
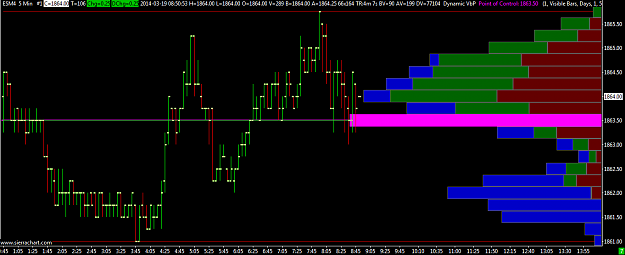
Hi RS, As you said it would ok to post some charts, here we go, using ES as an example. I think the charts look a bit busy, what do you think? First one is M5 using trading period 0700 - 2045. Second one is M120 for 120 days, using same trading ...
Surfing Risk Intraday - Volume Profile and Order flow
![Click to Enlarge
Name: ESM4 [CBV] 120 Min #2 41743.97.png
Size: 49 KB](/attachment/image/1406970/thumbnail?d=1397518196)
![Click to Enlarge
Name: ESM4 [CBV] Daily #3 41743.971.png
Size: 40 KB](/attachment/image/1406971/thumbnail?d=1397518211)
- 236dave replied Mar 28, 2014
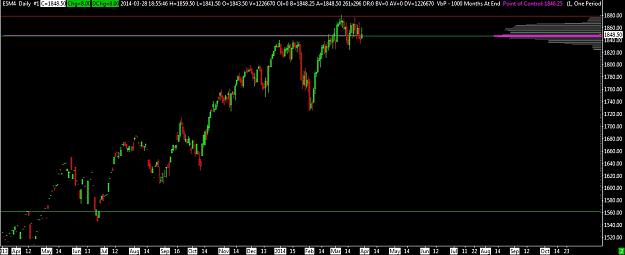
Hi RS Newbie question again. I am trying to copy your charts using EMiniS&P500 as an example, I have ESM4 on a 5 min chart, I also have it on a 120 min at 120 day length and on a daily chart. On the 120 min and especially on the daily there is ...
Surfing Risk Intraday - Volume Profile and Order flow
- 236dave replied Mar 26, 2014
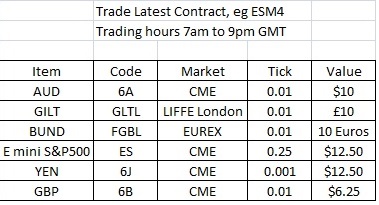
Hi RS, Thanks to you and your colleague for sharing the template. I am gradually getting my head around Sierra charts. I hope you have patience with my newbie questions: Is the attached the correct items / markets you trade on? All the best Dave ...
Surfing Risk Intraday - Volume Profile and Order flow
- 236dave replied Mar 19, 2014
Hi RS I managed to get a trial Sierra chart running with data feed from S5 demo account. S5 helped with instructions. I have had a little play with adding the Volume by Price study, see chart attached, I see you also tried Sierra chart on post #113. ...
Surfing Risk Intraday - Volume Profile and Order flow
- 236dave replied Feb 23, 2014
Hi, I have been checking out a strategy using a Renko mean live offline chart (indy attached). It shows promissing results when visually backtesting, but I know that Renko can plot history differently to what you would get in live conditions. I ...
Renko Block Charts
- 236dave replied Oct 11, 2013
Hi Alfonso, My first post on your thread. First of all thanks for sharing your system. I have read the first post a number of times and think that weekly / H4 swing trading could suit my life style. I work full time, but should be able to check on ...
Supply and demand in a nutshell by Alfonso Moreno
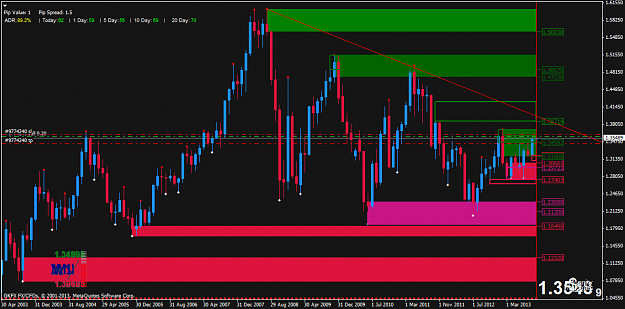
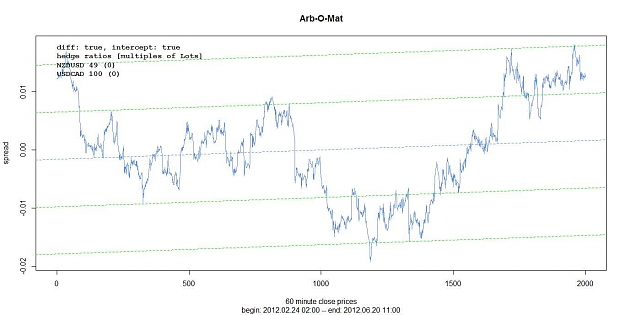
- 236dave replied Jun 20, 2012
Number of trades? — Hi, I have set up usdcad with nzdusd on H1 t/f, same as Dirtybrown is trading, I think. I realise that the Arbomat is a shifting window and it is difficult to do a visual look back. But it appears that if we are trading ...
System to hedge every major dollar pair for profit / low DD
- 236dave replied Nov 21, 2011
MA Cross missing arrows — There are a number of people questioning the MA cross, one person sppotted that it was based on LWMA not EMA, ok this isn't an issue, but it appears that arrows are missing when the cross only lasts for one bar. I ...
Fratelli Intraday trading system
- 236dave replied Nov 20, 2011
EMA Cross Arrows — Re:White Arrows There appears to be some missing arrows, ie there should be a up arrow followed by a down arrow followed by an up arrow etc, etc, see attached chart.
Fratelli Intraday trading system
- 236dave replied Nov 19, 2011
Can some kind soul please check the charts attached. The blue lines are the trigger bars where you would place a pending order. I am not sure that I am doing this right?
Fratelli Intraday trading system
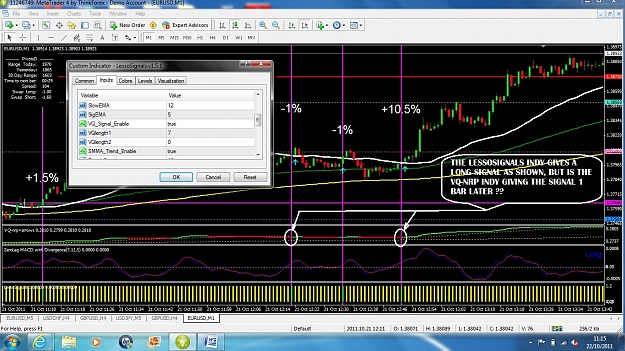
- 236dave replied Oct 22, 2011
Interesting system — I have read though the thread with interest. Thanks Lesso for sharing your system and to Easyryder for his indy's. I have setup a chart as attached, but have some questions which I hope you can answer: 1. I have shown some ...
Ema+vq+macd System
- 236dave replied Sep 9, 2011
Question — Hi Rocky, I have been following your thread around my day job and have picked some trades myself which have worked out well and some not so well, but I think that was my fault - still learning on demo. Regarding the recent CHFJPY ...
Extracted Thread (per thread starter's request)