It is particularly beneficial for traders who require precise and objective trendline analysis without relying on manual chart drawing.
https://cdn.tradingfinder.com/file/5...4-by-tflab.zip
https://www.cryptocraft.com/thread/1...-trader-5-free
https://www.forexfactory.com/thread/...-in-metatrader
Prop Firm DrawDown Protector : Prop Firm Capital Protection Expert MT4 | Forex Money Management: Forex Trade Management Expert MT4 |ICT Concepts Indicator MT4 | Smart Money Concepts Expert MT4| Smart Money Trap Scanner | Get a free Expert Advisor license via Telegram and WhatsApp
Auto TrendLines Indicator Overview
The Auto TrendLines Indicator continuously analyzes price movement to identify pivot points and generate adaptive trendlines. These trendlines respond dynamically to changing market conditions, offering a clear visualization of bullish and bearish market structures.
Key features include:
- Automatic recognition of market trend direction
- Dynamic plotting of support and resistance trendlines
- Generation of breakout and reversal trading signals
- Compatibility with a wide range of trading instruments
Indicator Classification
The Auto TrendLines Indicator belongs to multiple technical analysis categories, such as:
- Support and Resistance Indicators for MT4
- Signal and Forecast Indicators
- Price Level Analysis Indicators
Compatible Trading Platform
This indicator is designed specifically for use on:
- MetaTrader 4 (MT4)
Recommended Skill Level
The Auto TrendLines Indicator is appropriate for:
- Beginner and entry-level traders
- Traders seeking automated trendline solutions
Indicator Functionality Type
This indicator operates as:
- A breakout identification tool
- A trend reversal detection indicator
Supported Timeframes
The Auto TrendLines Indicator functions as a:
- Multi-timeframe indicator for MT4
It can be applied across all chart timeframes, including both intraday and higher-timeframe charts.
Suitable Trading Styles
This indicator supports various trading strategies, including:
- Day trading
- Scalping
- Swing trading
Supported Financial Markets
The Auto TrendLines Indicator can be applied to multiple asset classes, such as:
- Forex pairs
- Cryptocurrencies
- Commodities
- Stocks and shares
- Market indices
Auto TrendLines Indicator Visual Behavior
Trend direction is visually distinguished using color coding:
- Green trendlines indicate ascending trends and act as support levels
- Red trendlines indicate descending trends and function as resistance levels
When price interacts with these trendlines through breakouts or retracements, the indicator automatically produces trade signals aligned with the prevailing trend.
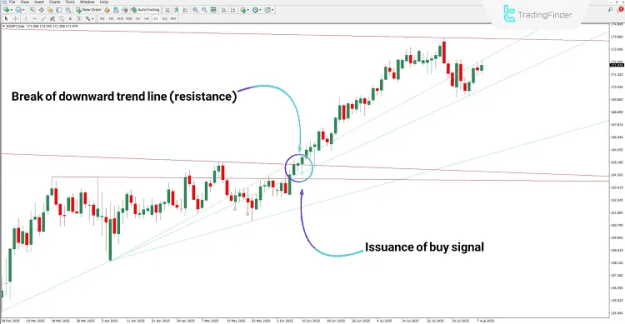
Buy Signal Conditions
A buy signal is generated when price breaks above a descending trendline.
Example scenario:
- On the EUR/JPY daily chart, price breaks the downward trendline
- The indicator identifies the breakout
- A green arrow appears, signaling a potential buy opportunity
This signal suggests either bullish continuation or a possible trend reversal.
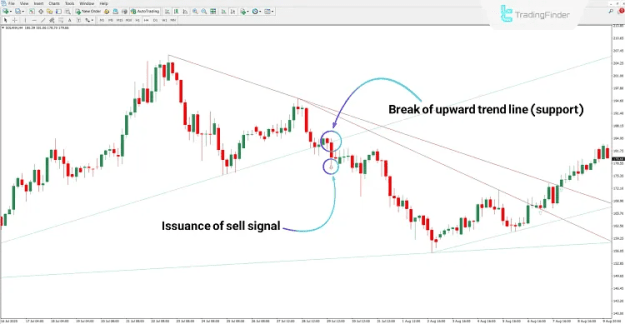
Sell Signal Conditions
A sell signal occurs when price breaks below an ascending trendline.
Example scenario:
- On the 4-hour Solana (SOL) chart
- Price breaks the upward support trendline
- The indicator displays a red arrow as a sell signal
This movement indicates potential bearish momentum or downside continuation.
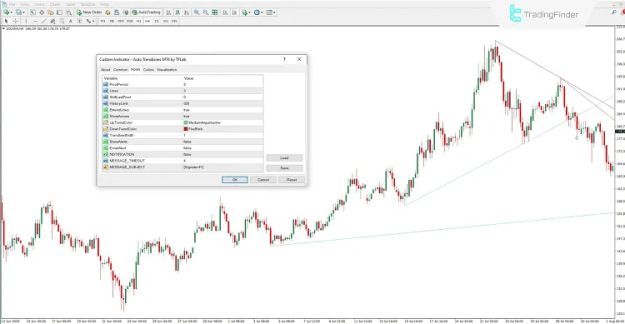
Auto TrendLines Indicator Settings
The indicator includes a range of adjustable parameters that allow traders to customize its performance according to their trading approach.
Key settings include:
- Pivot period for identifying pivot points
- Number of trendlines shown on the chart
- Adjustment of the most recent pivot position
- Historical candle analysis range
- Extension of trendlines across the chart
- Display options for signal arrows
- Color customization for uptrend and downtrend lines
- Control over trendline thickness
- On-chart alert activation
- Email alert functionality
- Push notifications to platform or device
- Alert message display duration
- Custom alert message title
Conclusion
The Auto TrendLines Indicator is a reliable and intelligent tool for traders who depend on trendline-based market analysis. By automatically generating uptrend and downtrend lines using pivot point data, it removes subjective bias and improves analytical precision.
With accurate detection of support and resistance levels, combined with timely breakout and retracement signals, the Auto TrendLines Indicator enables traders to make well-informed buy and sell decisions across multiple markets and timeframes.