By utilizing a logic similar to the Zigzag indicator, the tool isolates significant price swings to label pivot points, allowing traders to execute entries with precision based on verified market momentum.
https://cdn.tradingfinder.com/file/6...5-by-tflab.zip
https://www.cryptocraft.com/thread/1...mt4-free-tflab
https://www.forexfactory.com/thread/...-in-metatrader
Prop Firm DrawDown Protector : Prop Firm Capital Protection Expert MT5 |Forex Money Management: Forex Trade Management Expert MT5 | ICT Concepts Indicator MT5 |Smart Money Concepts Expert MT5 | Smart Money Trap Scanner | Get a free Expert Advisor license via Telegram and WhatsApp
Technical Specifications and Features
The following summary outlines the primary categories and operational parameters for the Show 123 Pattern Indicator within the MetaTrader 5 (MT5) environment:
- Indicator Categories: Signal & Forecast, Trading Assistant, and Classic Chart Indicators.
- Platform Compatibility: Exclusively for MetaTrader 5 (MT5).
- Required Expertise: Intermediate.
- Primary Type: Trend Reversal Indicator.
- Timeframe Flexibility: Multi-timeframe capabilities (M1 to Monthly).
- Trading Styles: Optimized for Intraday and Swing Trading.
- Market Applicability: Forex, Cryptocurrencies, and Global Stock Indices.
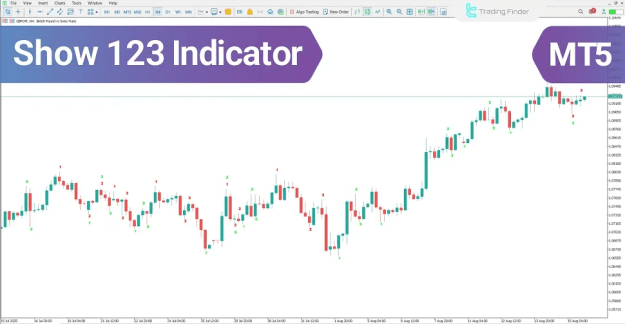
Show 123 Pattern Indicator at a Glance
The core objective of the Show 123 Pattern Indicator is to pinpoint specific zones where a trend is likely to exhaust or accelerate. Unlike a standard Zigzag, this tool emphasizes the Trigger Point—the moment price breaches level 2—which serves as the catalyst for a shift in market momentum.
The indicator identifies three critical structural nodes:
- Point 1: The origin of the main wave, representing a major swing high or low.
- Point 2: The termination of the corrective wave or the initial change in price trajectory.
- Point 3: The secondary correction, where the market stabilizes before a breakout or reversal occurs.
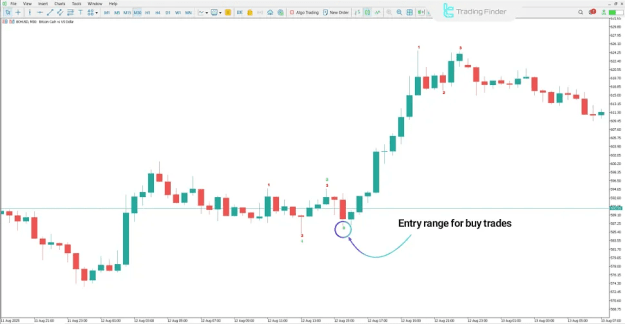
Utilizing the Indicator in an Uptrend
In a bullish scenario, the Show 123 Indicator visualizes the transition from a bearish phase to a buyer-dominated market. The pattern is typically highlighted in green on the MT5 interface.
Analysis of the Bullish Structure:
- Point 1: Establishes the market floor (recent low).
- Point 2: Marks the peak of the initial impulse, acting as a temporary resistance level.
- Point 3: Represents a "Higher Low" correction. Crucially, price remains above Point 1, signaling that selling pressure is dissipating.
Entry Signal: A high-probability Buy Entry is triggered when a bullish candle closes following the formation of Point 3, confirming the market’s intent to challenge and break the resistance at Point 2.
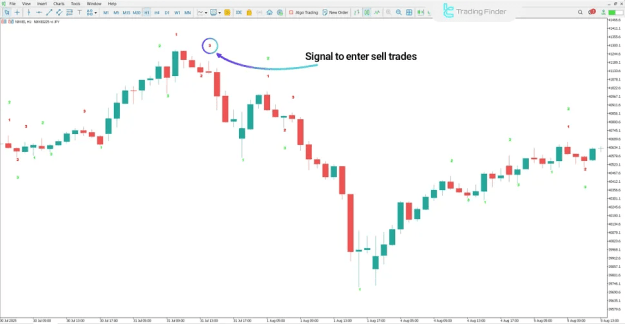
Utilizing the Indicator in a Downtrend
Conversely, the indicator excels at identifying "Lower High" setups, which precede significant market sell-offs. This is particularly effective on higher timeframes like the 1-hour (H1) chart for indices and major pairs.
Analysis of the Bearish Structure:
- Point 1: The market peak or the absolute high of the current move.
- Point 2: The initial low point that establishes temporary support.
- Point 3: A weak upward retracement that fails to reach the height of Point 1, indicating seller dominance.
Entry Signal: This structure defines a premium Sell Entry range. A confirmed break below the Point 2 support level validates the start of a strong bearish trend.
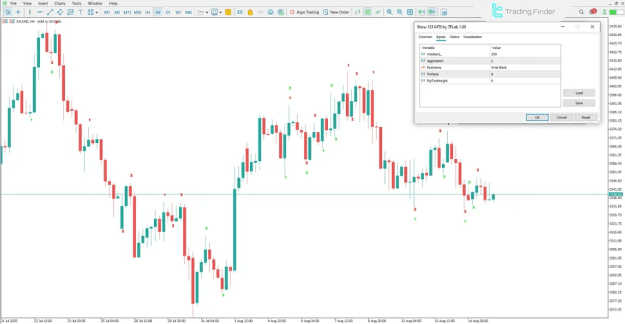
Show 123 Pattern Indicator Settings
To optimize the tool for specific market conditions or volatility levels, traders can customize the following parameters in the MT5 settings panel:
- Max Bars: Defines the historical candle depth the indicator processes for pattern identification.
- Aggression: Adjusts the sensitivity. Higher aggression detects minor fluctuations; lower aggression focuses on major market swings.
- Visual Customization: Users can modify the Font Name, Font Size, and Pip Text Height to ensure the labels are legible against their specific chart background and resolution.
Conclusion
The Show 123 Pattern Indicator is a robust solution for traders seeking to capitalize on breakout levels and trend continuations. By filtering out market noise and focusing on the relationship between three pivotal price points, it provides a clear roadmap for entry and exit.
In summary, when Point 3 holds a higher low in an uptrend, it signals buyer accumulation. In a downtrend, a lower high at Point 3 followed by a breach of level 2 confirms the strength of the bears.