https://cdn.tradingfinder.com/file/5...4-by-tflab.zip
https://www.cryptocraft.com/thread/1...tatrader-5-mt5
https://www.forexfactory.com/thread/...-in-metatrader
Prop Firm DrawDown Protector : Prop Firm Capital Protection Expert MT4 | Forex Money Management: Forex Trade Management Expert MT4 |ICT Concepts Indicator MT4 | Smart Money Concepts Expert MT4| Smart Money Trap Scanner | Get a free Expert Advisor license via Telegram and WhatsApp
Didi Index Indicator Specifications
The Didi Index is a versatile tool compatible with various trading strategies and asset classes. Its technical classifications include:
- Indicator Categories: Oscillators, Signal & Forecast, and Currency Strength Indicators for MT4.
- Platform Compatibility: Specifically optimized for MetaTrader 4 (MT4).
- Required Trading Skills: Suitable for Elementary to Advanced levels.
- Indicator Type: Reversal Identification.
- Applicable Timeframes: Multi-timeframe functionality.
- Trading Styles: Ideal for Day Trading, Scalping, and Swing Trading.
- Market Instruments: Stocks, Indices, Commodities, Cryptocurrencies, and Forex.
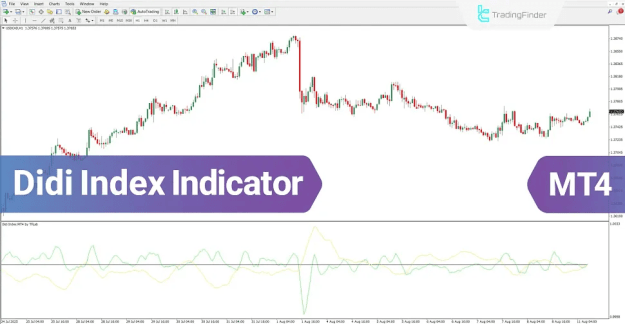
Didi Index Indicator at a Glance
The core functionality of the Didi Index revolves around the interaction between its oscillating lines and the middle line (equilibrium level). Traders monitor these crossovers to determine high-probability entry and exit points.
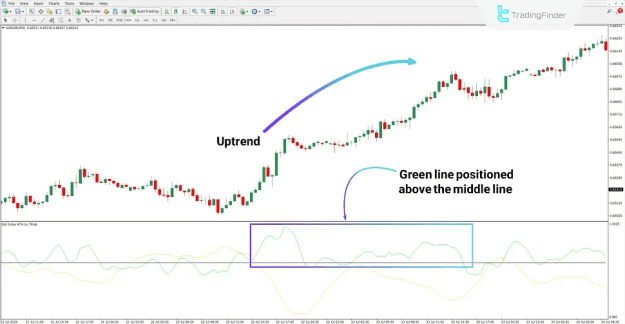
- Buy Signal: Generated when the green line crosses and maintains a position above the middle line, suggesting the emergence of bullish momentum.
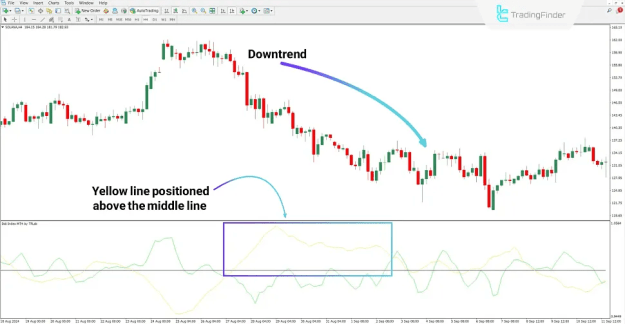
- Sell Signal: Generated when the yellow line fluctuates above the middle line, indicating a shift toward a bearish trend.
Uptrend Signal
In a standard market scenario, such as the 30-minute chart of the AUD/USD, an uptrend is confirmed when the green line sustains its movement above the oscillator’s midpoint. This crossover serves as a leading indicator that the prevailing market sentiment has turned bullish, allowing traders to seek long positions.
Downtrend Signal
Conversely, analyzing a 4-hour chart of Solana (SOL) may reveal the yellow line ascending above the middle line. This specific positioning serves as a cautionary signal or a direct sell entry, highlighting a potential downward trend and increasing bearish pressure.
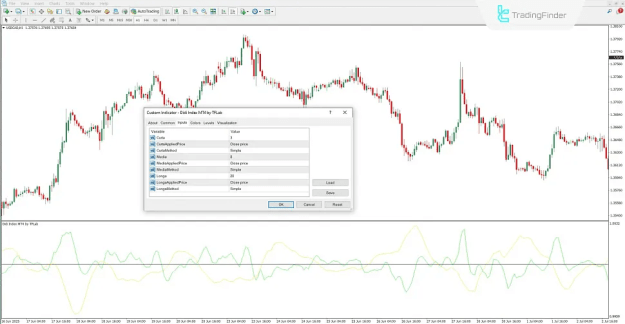
Didi Index Indicator Settings
To achieve precision in market analysis, the Didi Index utilizes three distinct periods for its calculations. Understanding these variables is essential for customizing the indicator to specific market conditions:
- Curta (Short-term): The period used for the fast index calculation.
- CurtaAppliedPrice: Typically set to the Closing Price for the short-term calculation.
- CurtaMethod: The Moving Average method applied (standardly the Simple Moving Average).
- Media (Medium-term): The central period used to establish the baseline/middle line.
- MediaAppliedPrice: The price basis for the medium-term calculation.
- MediaMethod: The mathematical method used for the medium-term period.
- Longa (Long-term): The period used for the slow index calculation.
- LongaAppliedPrice: The price basis for the long-term calculation.
- LongaMethod: The Moving Average method applied to the long-term period.
Conclusion
The Didi Index indicator serves as a robust framework for identifying trade entries by synthesizing three distinct moving average periods (short, medium, and long-term). By focusing on the crossover moments of these lines, the oscillator provides a clear and objective methodology for navigating trend reversals and trend continuations. Whether you are trading Forex, Stocks, or Crypto, the Didi Index offers a streamlined approach to technical market analysis.