By mathematically analyzing the disparity between price action and momentum velocity, this tool isolates specific market conditions where the prevailing trend exhibits signs of exhaustion. Consequently, it serves as a predictive signal for potential market reversals or imminent price corrections.
https://cdn.tradingfinder.com/file/5...5-by-tflab.zip
https://www.cryptocraft.com/thread/1...mt4-free-tflab
https://www.forexfactory.com/thread/...-in-metatrader
Prop Firm DrawDown Protector : Prop Firm Capital Protection Expert MT5 |Forex Money Management: Forex Trade Management Expert MT5 | ICT Concepts Indicator MT5 |Smart Money Concepts Expert MT5 | Smart Money Trap Scanner | Get a free Expert Advisor license via Telegram and WhatsApp
Knoxville Divergence Detection Indicator Specifications Table
The technical specifications and functional attributes of the Knoxville Divergence Detection Indicator are outlined below:
- Indicator Categories: Signal & Forecast MT5 Indicators, Trading Assist MT5 Indicators, Momentum Indicators in MT5.
- Platform Compatibility: MetaTrader 5 (MT5).
- Required Skill Level: Intermediate.
- Functional Type: Reversal Indicators.
- Timeframe Capability: Multi-Timeframe functionality.
- Trading Styles: Suitable for Swing Trading, Scalping, and Day Trading strategies.
- Tradable Instruments: Forex, Cryptocurrency, and Stock Market assets.
Knoxville Divergence Detection Indicator at a Glance
The Knoxville Divergence Indicator systematically scans market momentum to detect price divergences, visualizing these technical anomalies as distinct colored lines directly on the price chart.
The visual coding is defined as follows:
- Green Line: Represents the identification of a positive (bullish) divergence.
- Red Line: Indicates the presence of a negative (bearish) divergence.
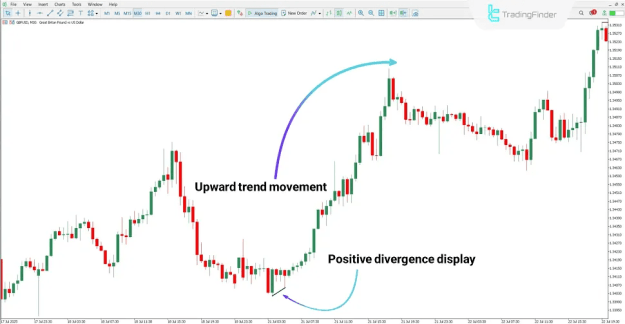
Positive Divergence
An analysis of the GBP/USD pair on a 30-minute timeframe demonstrates the indicator's detection mechanism. The tool highlights a significant divergence where price action conflicts with momentum readings.
In such scenarios, market participants may interpret the signal as a high-probability setup for entering long positions, contingent upon their broader risk management and trading strategy.
- Uptrend analysis: Leveraging the Knoxville Divergence Indicator for bullish confirmation.
- Reversal Zone Identification: Pinpointing entry levels using divergence analysis.
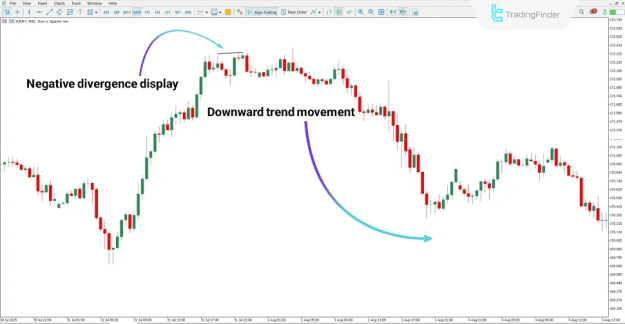
Negative Divergence
Examining the EUR/JPY chart, the indicator reveals a negative divergence by comparing the asset's price trajectory against underlying momentum. As evidenced in historical performance, the asset entered a sustained downtrend immediately following the manifestation of this divergence signal.
- Downtrend analysis: assessing bearish momentum with the Knoxville Divergence Indicator.
- Short-Selling Opportunities: Identifying optimal exit or short-entry points.
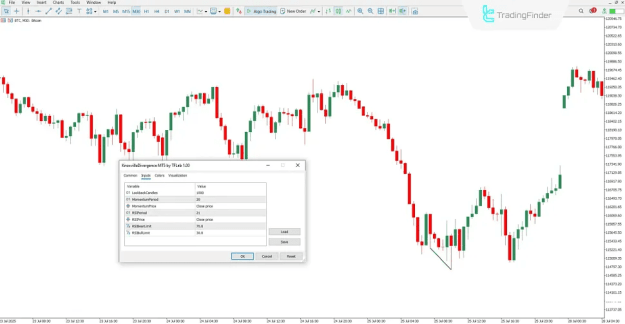
Knoxville Divergence Indicator Settings
To allow for customization according to specific market volatilities, the Knoxville Divergence Detection Indicator includes the following adjustable parameters:
- LookbackCandles: Defines the quantity of historical candles analyzed for divergence patterns.
- MomentumPeriod: Sets the time period for the Momentum calculation.
- MomentumPrice: Specifies the price type utilized for the Momentum calculation.
- RSIPeriod: Sets the time period for the RSI calculation.
- RSIPrice: Specifies the price type utilized for the RSI calculation.
- RSIBearLimit: Defines the threshold value for overbought conditions.
- RSIBullLimit: Defines the threshold value for oversold conditions.
Conclusion
The Knoxville Divergence Detection Indicator effectively synthesizes RSI and Momentum data to analyze the discrepancy between nominal price movement and actual market strength.
By rendering these divergences as green lines for bullish signals and red lines for bearish signals, the indicator functions as a robust early warning system. It is particularly valuable for traders seeking to identify potential trend reversal zones before price action confirms the shift.