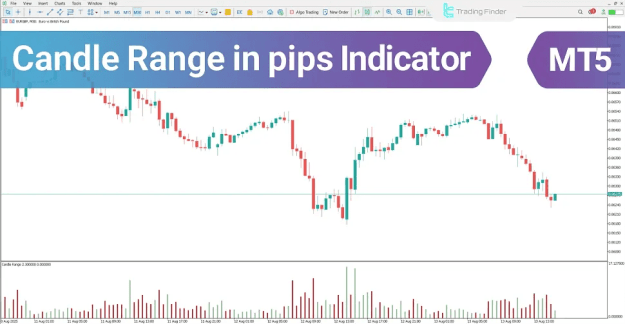
This volatility indicator renders a bar histogram positioned at the bottom of the price chart, where each bar corresponds to the magnitude of movement for the specific candle. within this oscillator structure, the histogram utilizes color-coding to enhance visual interpretation: green bars denote bullish candles, while red bars represent bearish candles.
https://cdn.tradingfinder.com/file/5...5-by-tflab.zip
https://www.cryptocraft.com/thread/1...cator-mt4-free
https://www.forexfactory.com/thread/...-in-metatrader
Prop Firm DrawDown Protector : Prop Firm Capital Protection Expert MT5 |Forex Money Management: Forex Trade Management Expert MT5 | ICT Concepts Indicator MT5 |Smart Money Concepts Expert MT5 | Smart Money Trap Scanner | Get a free Expert Advisor license via Telegram and WhatsApp
Candle Range in pips Indicator Table
The following specifications outline the general features and technical attributes of the Candle Range in pips indicator for the MetaTrader 5 platform:
- Indicator Categories: MT5 Oscillators, Trading Assist Indicators, Momentum Indicators in MT5.
- Platform Compatibility: MetaTrader 5 (MT5).
- Required Skill Level: Elementary.
- Indicator Types: Reversal Indicators.
- Timeframe Capability: Multi-Timeframe Indicators.
- Trading Styles: Intraday Trading.
- Trading Instruments: Forex, Cryptocurrency, and Stock Market Indicators.
Candle Range in pips at a Glance
In the operational framework of the Candle Range in pips indicator, fluctuations in the height of the histogram bars serve as a direct metric of real-time market volatility.
These variations provide critical insights regarding:
- The strength of price action.
- The probability of breaching key technical levels.
- Imminent shifts in market momentum.
Furthermore, this analytical tool is integral to various trading methodologies, including Price Action, Scalping, and Breakout strategies. It functions as an effective time filter, playing a pivotal role in the identification of precise entry and exit points.
Indicator in an Uptrend
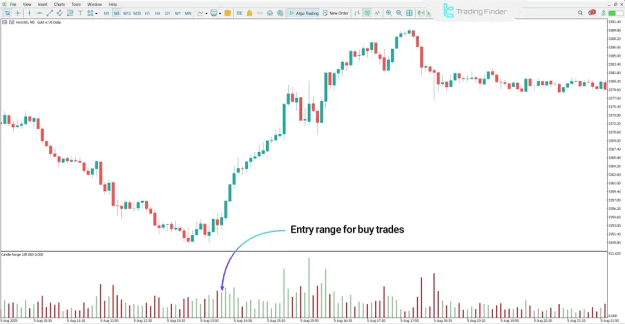
The analysis of the Gold Spot Index (XAU/USD) on a 5-minute timeframe illustrates the indicator's utility during a bullish phase.
When the histogram bar height demonstrates a gradual increase and price action surpasses established resistance zones—specifically when a bullish breakout coincides with an expansion in volatility—this condition signals a significant strengthening of buying pressure.
- Uptrend conditions: Analyzing bullish momentum with the Candle Range in pips Indicator.
- Entry range identification: Locating optimal buy trade entries based on volatility expansion.
Indicator in a Downtrend
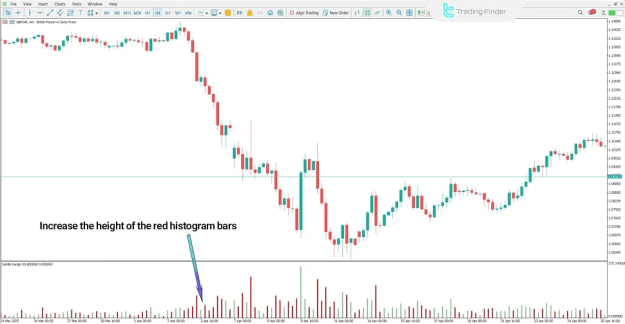
The GBP/CHF index on a 4-hour timeframe demonstrates the indicator's behavior during a bearish trend. In this context, the breakdown of support levels is accompanied by widening volatility ranges and the formation of extended candles with distinct upper shadows.
These technical formations are interpreted as signs of increasing selling pressure, creating a favorable environment for initiating sell positions.
- Downtrend conditions: Assessing bearish strength using the Candle Range in pips Indicator.
- Downtrend visualization: Viewing volatility spikes on MetaTrader 5 during price drops.
Conclusion
The Candle Range in pips Oscillator is considered one of the most effective tools for measuring the actual volatility inherent in candlestick formations.
By systematically analyzing the price movement range within each candle, this trading instrument offers a transparent perspective on the intensity of market momentum. Consequently, it is invaluable for forecasting the potential breakage of key levels or the onset of trend reversals.