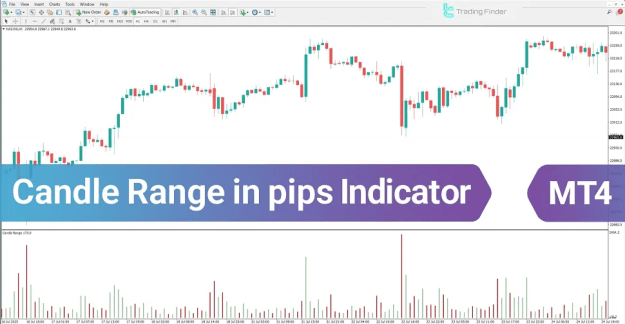
The Candle Range in Pips Indicator MT4 provides a precise measurement of each candlestick’s range, defined as the difference between its High and Low. It represents price volatility through a bar histogram at the bottom of the chart, where each bar corresponds to a single candle’s movement. Green bars indicate bullish candles, while red bars indicate bearish candles, allowing traders to clearly observe market trends and momentum.
 You can download it from this link:
https://cdn.tradingfinder.com/file/5...4-by-tflab.zip
 You can also access the MetaTrader 5 version of this Indicator through this page:
https://www.cryptocraft.com/thread/1...tatrader-5-mt5
 For instructions on how to install:
https://www.forexfactory.com/thread/...-in-metatrader
Prop Firm DrawDown Protector : Prop Firm Capital Protection Expert MT4 | Forex Money Management: Forex Trade Management Expert MT4 |ICT Concepts Indicator MT4 | Smart Money Concepts Expert MT4| Smart Money Trap Scanner | Get a free Expert Advisor license via Telegram and WhatsApp
Features
This indicator functions as an oscillator, a trading assist tool, and a momentum indicator within MetaTrader 4. It is suitable for traders at an elementary level, supporting reversal analysis across multiple timeframes. The tool is applicable to intraday trading and compatible with Forex, cryptocurrency, and stock markets.
Candle Range Insights
Fluctuations in histogram bar height provide insights into market volatility, the probability of breaking key levels, and potential momentum shifts. It is widely utilized in Price Action, Scalping, and Technical Breakout strategies, serving as a reliable time filter for entry and exit decisions.
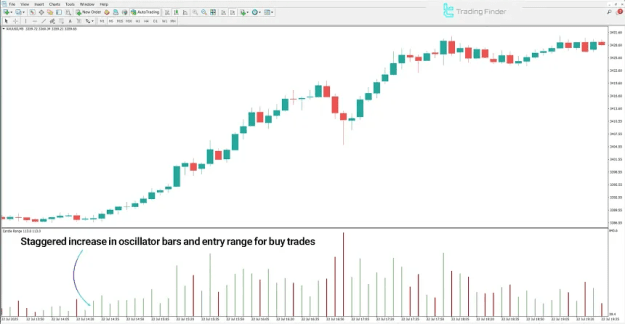
Indicator in an Uptrend
For example, in the Gold Spot Index (XAU/USD) on a 5-minute chart, increasing histogram heights combined with price breaking previous resistance and a bullish breakout indicate strengthening buyers and the potential continuation of the uptrend.
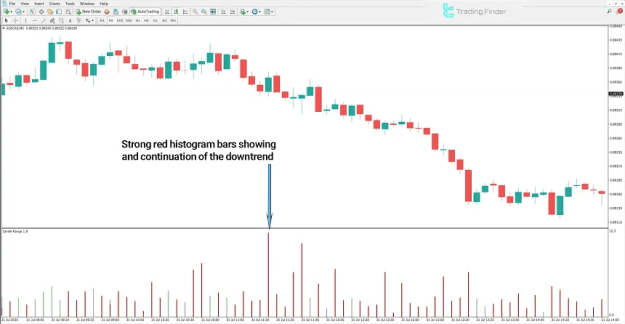
Indicator in a Downtrend
For the AUD/CAD pair on a 5-minute chart, a support breakdown along with rising volatility and long candles with upper shadows signals increased selling pressure and trend intensification. When these patterns follow a consolidation period, they suggest a shift from neutral to bearish sentiment.
Conclusion
The Candle Range in Pips Oscillator is a precise tool for measuring candlestick volatility. Monitoring changes in candle ranges delivers actionable insights into momentum strength and the likelihood of trend continuation or reversal. Consistent increases or decreases in range, especially near key price levels, highlight market phase transitions and support informed trading decisions.
https://cdn.tradingfinder.com/file/5...4-by-tflab.zip
https://www.cryptocraft.com/thread/1...tatrader-5-mt5
https://www.forexfactory.com/thread/...-in-metatrader
Inserted Video
Prop Firm DrawDown Protector : Prop Firm Capital Protection Expert MT4 | Forex Money Management: Forex Trade Management Expert MT4 |ICT Concepts Indicator MT4 | Smart Money Concepts Expert MT4| Smart Money Trap Scanner | Get a free Expert Advisor license via Telegram and WhatsApp
Features
This indicator functions as an oscillator, a trading assist tool, and a momentum indicator within MetaTrader 4. It is suitable for traders at an elementary level, supporting reversal analysis across multiple timeframes. The tool is applicable to intraday trading and compatible with Forex, cryptocurrency, and stock markets.
Candle Range Insights
Fluctuations in histogram bar height provide insights into market volatility, the probability of breaking key levels, and potential momentum shifts. It is widely utilized in Price Action, Scalping, and Technical Breakout strategies, serving as a reliable time filter for entry and exit decisions.
Indicator in an Uptrend
For example, in the Gold Spot Index (XAU/USD) on a 5-minute chart, increasing histogram heights combined with price breaking previous resistance and a bullish breakout indicate strengthening buyers and the potential continuation of the uptrend.
Indicator in a Downtrend
For the AUD/CAD pair on a 5-minute chart, a support breakdown along with rising volatility and long candles with upper shadows signals increased selling pressure and trend intensification. When these patterns follow a consolidation period, they suggest a shift from neutral to bearish sentiment.
Conclusion
The Candle Range in Pips Oscillator is a precise tool for measuring candlestick volatility. Monitoring changes in candle ranges delivers actionable insights into momentum strength and the likelihood of trend continuation or reversal. Consistent increases or decreases in range, especially near key price levels, highlight market phase transitions and support informed trading decisions.
Attached Image(s) (click to enlarge)