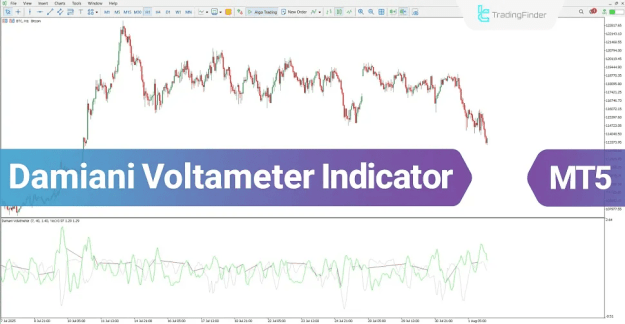
Unlike conventional signal generators that provide direct entry points, this tool functions as a market filter. It evaluates the condition of the market to determine whether the environment is favorable or unfavorable for trading.
Its architecture utilizes a dual-curve system: a Green Line representing intrinsic volatility and a Gray Line representing market noise. By analyzing the interplay between these two curves, the indicator defines the validity of current market fluctuations.
https://cdn.tradingfinder.com/file/5...5-by-tflab.zip
https://www.cryptocraft.com/thread/1...r-for-mt4-free
https://www.forexfactory.com/thread/...-in-metatrader
Prop Firm DrawDown Protector : Prop Firm Capital Protection Expert MT5 |Forex Money Management: Forex Trade Management Expert MT5 | ICT Concepts Indicator MT5 |Smart Money Concepts Expert MT5 | Smart Money Trap Scanner | Get a free Expert Advisor license via Telegram and WhatsApp
Damiani Voltameter Indicator Specifications
Below are the technical classifications and capabilities of the Damiani Voltameter Oscillator:
- Platform Compatibility: Exclusively for MetaTrader 5 (MT5).
- Indicator Categories: Classified under Oscillators, Volatility Indicators, and Signal & Forecast tools.
- Operational Type: Functions as both a Range Detector and a Reversal Indicator.
- Skill Level: Recommended for Intermediate traders.
- Timeframe Utility: A Multi-Timeframe indicator adaptable to various chart periods.
- Trading Styles: Effective for Scalping, Day Trading, and Swing Trading strategies.
- Supported Instruments: Applicable across Forex pairs, Cryptocurrencies, and Stock markets.
Damiani Voltameter Oscillator: Operational Mechanics
The core functionality of the Damiani Voltameter relies on the relative positioning of its volatility and noise components:
- Market Activity: When the Green line (Volatility) is positioned above the Gray line (Noise), it indicates real, reliable market movement suitable for trading.
- Market Stagnation: Conversely, if the Gray line surpasses the Green line, the market is deemed to be in a low-volatility or "ranging" phase.
- Visual Warning: During periods of significant noise dominance, the indicator renders a horizontal Red line, visually demarcating the zone as non-tradable.
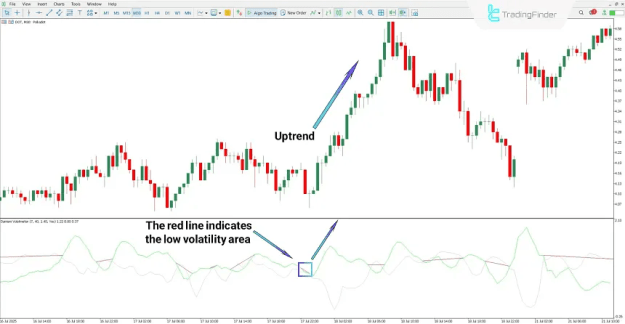
Identifying Uptrend Conditions
In a practical application using the Polkadot (DOT) cryptocurrency 30-minute chart, the indicator demonstrates its filtering capability. Initially, the Gray line remains above the Green line, signaling a ranging market with low volatility.
During this phase, the indicator identifies the non-trending zone by maintaining the horizontal Red line. As illustrated in the chart, a viable trading opportunity emerges strictly after the Green line crosses above the Gray line. This crossover confirms that volatility has overtaken noise, marking the beginning of a clear upward trajectory.
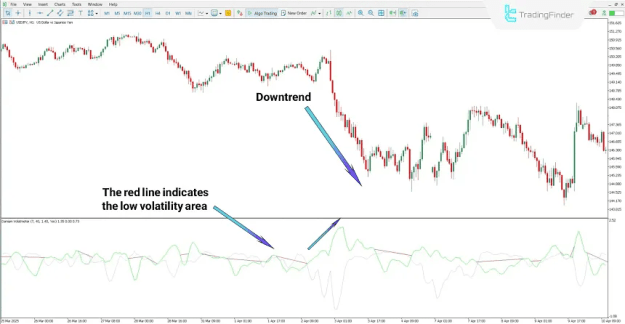
Identifying Downtrend Conditions
Analyzing the USD/JPY one-hour chart reveals the indicator's efficacy in bearish scenarios. A valid signal occurs when the Volatility line intersects the Gray line and sustains a position above it.
In this context, the crossover indicates that bearish pressure has become dominant. The price action subsequently breaks the consolidation range downward, entering a confirmed declining trend.
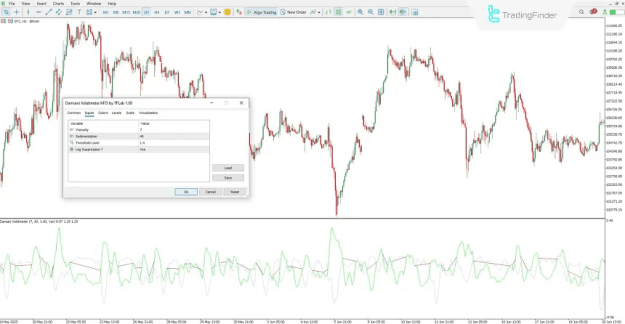
Configuration Settings of the Damiani Voltameter
To optimize the indicator for specific assets, the following parameters can be adjusted within the settings panel:
Review of Indicator Parameters
- Viscosity: Defines the specific number of candles utilized to calculate and quantify market noise.
- Sedimentation: Sets the period for smoothing price fluctuations, allowing for the assessment of continuous market behavior.
- Threshold_level: The benchmark value used to compare volatility against noise; this is critical for determining the sensitivity of the trading signal.
- Lag_suppressor: A boolean function that, when activated, reduces the delay in signal output to provide more reactive data.
Conclusion
The Damiani Voltameter Oscillator is engineered to act as a safeguard against unfavorable market conditions.
Rather than issuing speculative buy or sell commands, this indicator assesses the overall "tradability" of the asset. It ensures that traders only consider market entry when sufficient volatility exists to justify the risk, effectively filtering out the noise of sideways markets.