By integrating market volatility with momentum analysis, this oscillator enables traders to detect potential price reversal zones with greater accuracy and refine both entry and exit decisions across different financial markets.
https://cdn.tradingfinder.com/file/5...5-by-tflab.zip
https://www.cryptocraft.com/thread/1...r-for-mt4-free
https://www.forexfactory.com/thread/...-in-metatrader
Prop Firm DrawDown Protector : Prop Firm Capital Protection Expert MT5 |Forex Money Management: Forex Trade Management Expert MT5 | ICT Concepts Indicator MT5 |Smart Money Concepts Expert MT5 | Smart Money Trap Scanner | Get a free Expert Advisor license via Telegram and WhatsApp
Specifications of the Bollinger Bands RSI Indicator
The Bollinger Bands RSI Oscillator is engineered to accommodate diverse trading approaches and multiple asset classes, making it suitable for traders with varying levels of experience.
Indicator Categories
- Oscillators for MT5
- Bands & Channels for MT5
Supported Platform
- MetaTrader 5 (MT5)
Trading Skill Requirement
- Elementary
Indicator Classification
- Reversal Indicators for MT5
Timeframe Support
- Multi-Timeframe Analysis
Applicable Trading Styles
- Swing Trading
- Scalping
- Day Trading
Supported Markets
- Forex
- Cryptocurrencies
- Stocks
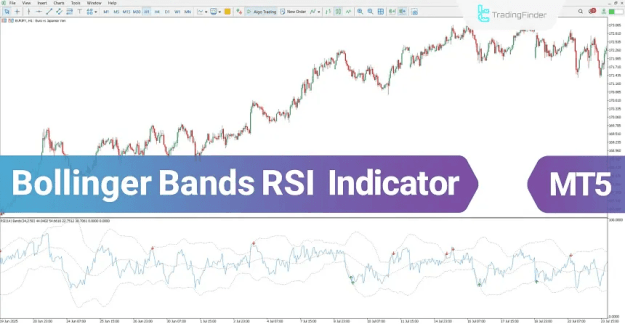
Overview of the Bollinger Bands RSI Oscillator
This oscillator analyzes the behavior of the RSI line in relation to the upper and lower Bollinger Bands, providing clear visual cues for market conditions.
- When the RSI reaches the lower Bollinger Band, the market is identified as oversold, and a green arrow signals a potential buying opportunity.
- When the RSI touches the upper Bollinger Band, overbought conditions are detected, and a red arrow indicates a possible sell setup.
These visual signals help traders quickly recognize high-probability trading scenarios.
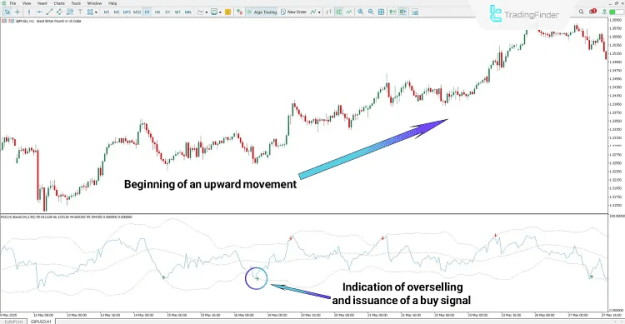
Buy Signal Conditions
On the GBP/USD chart using the 1-hour timeframe, a buy signal is generated when the RSI line touches the lower Bollinger Band, signaling an oversold environment.
At this stage:
- The indicator identifies a possible bullish reversal.
- A green arrow appears on the chart.
- Traders may consider entering long positions in alignment with emerging upward momentum.
Identifying Reversal Zones with the Bollinger Bands RSI Indicator
By combining RSI momentum dynamics with Bollinger Bands volatility limits, the indicator highlights zones where price movement may be losing strength.
This methodology enhances:
- Detection of reversal areas
- Precision in trade timing
- Optimization of risk-to-reward ratios
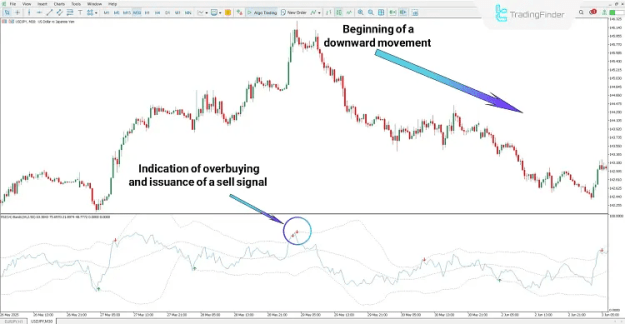
Sell Signal Conditions
On the USD/JPY chart in the 30-minute timeframe, a sell signal occurs when the RSI line makes contact with the upper Bollinger Band, indicating overbought market conditions.
In this situation:
- The indicator anticipates a potential bearish reversal.
- A red arrow is displayed.
- Traders may use this signal to initiate short positions.
Downtrend Analysis Using the Bollinger Bands RSI Oscillator
In bearish market environments, repeated interactions between the RSI line and the upper Bollinger Band often suggest either trend continuation or corrective pullbacks.
As a result, this oscillator is well-suited for:
- Short-term trend evaluation
- Counter-trend trading strategies
- High-precision sell entries
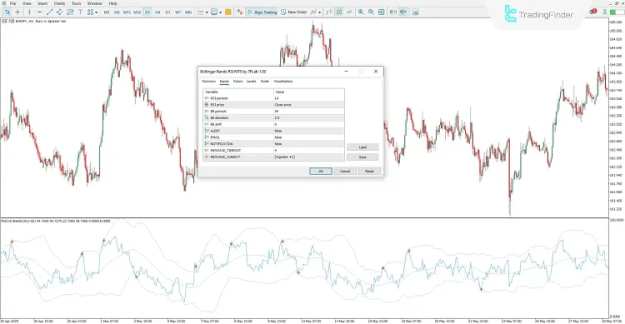
Settings of the Bollinger Bands RSI Indicator
The indicator offers multiple adjustable parameters, allowing traders to tailor its behavior to specific market conditions and personal trading strategies:
- RSI Period: Defines the calculation length of the Relative Strength Index
- RSI Price: Determines the price source used for RSI computation
- BB Periods: Specifies the number of periods used for Bollinger Bands
- BB Deviation: Sets the standard deviation value of the bands
- BB Shift: Adjusts the horizontal displacement of the bands
- ALERT: Enables visual or sound alerts
- EMAIL: Sends trading signals via email
- NOTIFICATION: Activates push notifications
- MESSAGE_TIMEOUT: Controls how long alert messages remain visible
- MESSAGE_SUBJECT: Defines the title of alert notifications
Conclusion
The Bollinger Bands RSI Oscillator combines volatility measurement with momentum analysis to effectively identify overbought and oversold market conditions.
- Contact with the lower band generates buy signals.
- Contact with the upper band produces sell signals.
This indicator serves as a reliable analytical tool for traders in forex, cryptocurrency, and stock markets, offering clear visual signals and flexible settings compatible with various trading styles