By simultaneously assessing price volatility and market momentum, this oscillator improves the identification of potential reversal zones and enhances the precision of both entry and exit decisions in trading.
https://cdn.tradingfinder.com/file/5...4-by-tflab.zip
https://www.cryptocraft.com/thread/1...r-metatrader-5
https://www.forexfactory.com/thread/...-in-metatrader
Prop Firm DrawDown Protector : Prop Firm Capital Protection Expert MT4 | Forex Money Management: Forex Trade Management Expert MT4 |ICT Concepts Indicator MT4 | Smart Money Concepts Expert MT4| Smart Money Trap Scanner | Get a free Expert Advisor license via Telegram and WhatsApp
Specifications of the Bollinger Bands and RSI Oscillator
Indicator Categories
- Oscillators MT4 Indicators
- Bands & Channels MT4 Indicators
Supported Platform
- MetaTrader 4 Indicators
Trading Skill Level
- Elementary
Indicator Type
- Reversal MT4 Indicators
Applicable Timeframes
- Multi-Timeframe MT4 Indicators
Trading Styles
- Day Trading MT4 Indicators
- Scalping MT4 Indicators
- Swing Trading MT4 Indicators
Trading Instruments
- Stock Market MT4 Indicators
- Cryptocurrency MT4 Indicators
- Forex MT4 Indicators
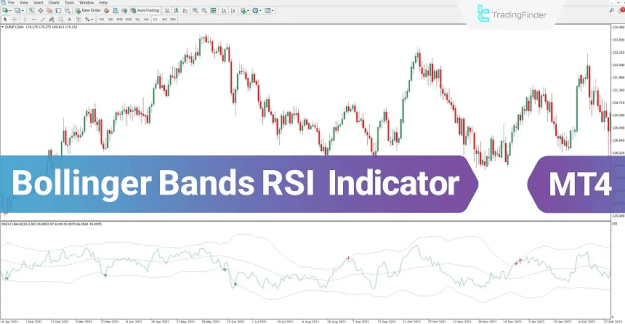
Bollinger Bands and RSI Indicator Overview
The Bollinger Bands and RSI Indicator evaluates the relationship between the RSI line and Bollinger Bands in order to identify overbought and oversold conditions.
- When the RSI line touches the lower Bollinger Band, the market enters an oversold phase, prompting the indicator to generate a buy signal.
- When the RSI line reaches the upper Bollinger Band, the market is considered overbought, and the indicator issues a sell signal, typically presented with a red arrow.
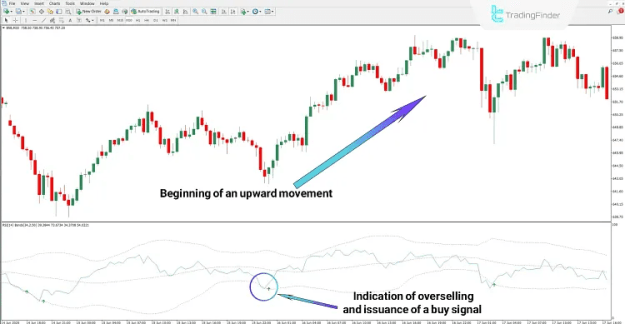
Buy Signal Example
On the Binance Coin (BNB) chart in the 30-minute timeframe, the RSI line touching the lower band indicated oversold market conditions. Shortly thereafter, the indicator detected a potential trend reversal and issued a buy signal with a green arrow at the exact point of contact.
Key Observations
- Confirmation of oversold territory
- Identification of reversal momentum
- Clear issuance of a buy signal
-
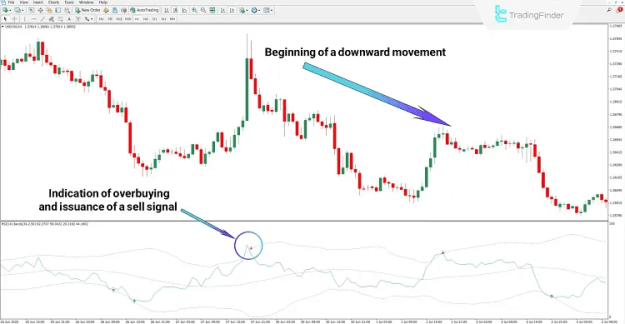
Sell Signal Example
On the USD/CAD chart within the 1-hour timeframe, the RSI line contacting the upper band signaled overbought conditions and the likelihood of a downward price movement.
At this stage, the Bollinger Bands and RSI Indicator generated a sell signal, validating the initiation of bearish momentum.
Key Observations
- Detection of overbought conditions
- Formation of a reversal pattern
- Confirmation of a sell opportunity
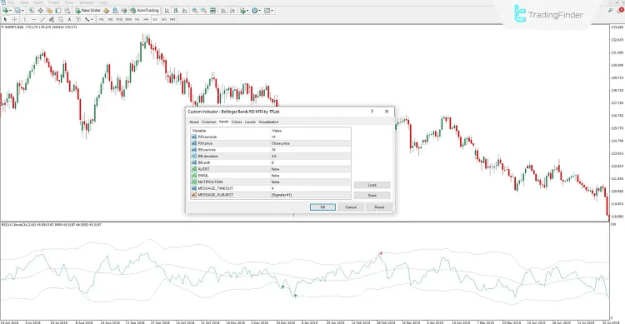
Settings of the Bollinger Bands and RSI Indicator
The indicator’s settings panel offers multiple adjustable parameters, enabling traders to customize the tool according to their preferred trading approach.
Adjustable Inputs
- RSI Period: Sets the calculation period for the Relative Strength Index
- RSI Price: Defines the price type used for RSI calculation
- BB Periods: Specifies the number of periods used in Bollinger Bands construction
- BB Deviation: Determines the standard deviation applied to the upper and lower bands
- BB Shift: Adjusts the horizontal displacement of Bollinger Bands on the chart
- ALERT: Activates real-time alert notifications
- EMAIL: Enables email-based signal notifications
- NOTIFICATION: Sends alerts via mobile or platform notifications
- MESSAGE_TIMEOUT: Controls how long pop-up messages remain visible
- MESSAGE_SUBJECT: Defines the alert message title
Conclusion
The Bollinger Bands and RSI Oscillator is a powerful combination tool designed to identify overbought and oversold conditions across a wide range of financial markets.
By integrating volatility measurement with momentum analysis, the indicator delivers accurate buy and sell signals whenever the RSI interacts with the Bollinger Bands.
This makes it a versatile and valuable resource for traders in cryptocurrency, forex, stocks, and commodities.