In addition to the main pattern, the indicator plots two converging, dashed red lines. These lines serve as a forecasting tool, highlighting a potential breakout point where the price is likely to make a significant move. This makes the indicator a valuable asset for traders of various skill levels, particularly those with elementary trading skills.
https://cdn.tradingfinder.com/file/3...4-by-tflab.zip
https://www.forexfactory.com/thread/...-in-metatrader
Prop Firm DrawDown Protector : Prop Firm Capital Protection Expert MT4 | Forex Money Management: Forex Trade Management Expert MT4 |ICT Concepts Indicator MT4 | Smart Money Concepts Expert MT4| Smart Money Trap Scanner | Get a free Expert Advisor license via Telegram and WhatsApp
Key Features and Specifications
This indicator is a multi-timeframe tool, suitable for a range of trading styles, including Intraday trading. It's versatile enough to be applied across a variety of trading instruments, such as:
- Forex (Foreign Exchange)
- Cryptocurrency
- Share Stocks and the broader Stock Market
- Forward Market instruments
The Triangle Pattern Indicator falls into several key categories:
- Price Action MT4 Indicators: It directly analyzes price movements.
- Signal & Forecast MT4 Indicators: It provides predictive signals for future price direction.
- Breakout MT4 Indicators: Its primary function is to identify and signal potential breakouts.
- Chart & Classic MT4 Indicators: It uses a classic chart pattern to provide trading insights.
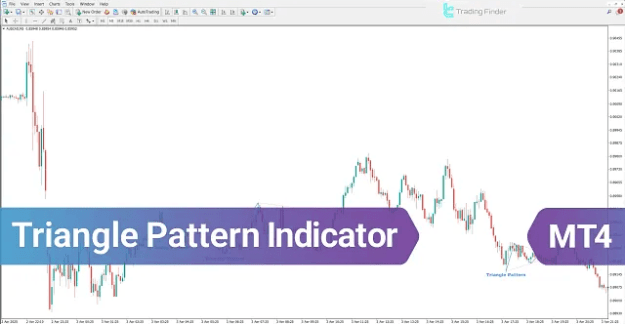
Understanding Triangle Pattern Conditions
The indicator helps traders recognize and act on two primary types of triangle patterns: ascending (bullish) and descending (bearish).
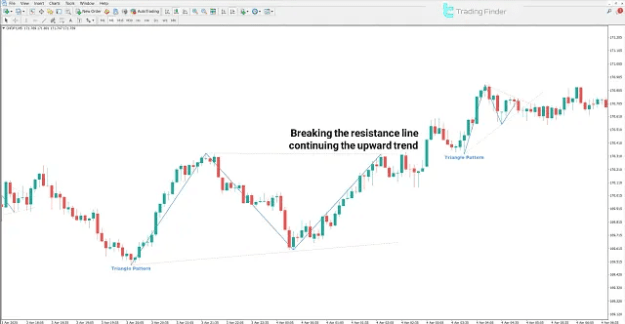
Ascending (Uptrend) Triangle Conditions
An ascending triangle pattern forms during an uptrend when the market encounters a dynamic resistance level while simultaneously forming a series of higher lows.
This pattern reflects a period where buyers are progressively gaining strength. The breakout above the resistance line is a key signal, indicating that buyers have overcome the selling pressure and a bullish move is likely to continue.
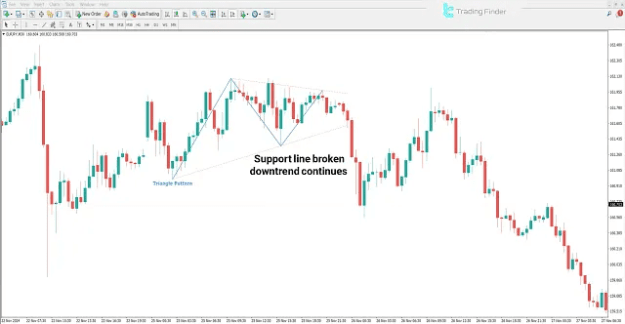
Descending (Downtrend) Triangle Conditions
Conversely, a descending triangle pattern represents price compression in a downtrend. It is characterized by a series of lower highs, forming a downward-sloping resistance line, and a dynamic support level that the price repeatedly tests. The breakout below this support level signals that sellers have taken control, increasing the probability of a bearish move.
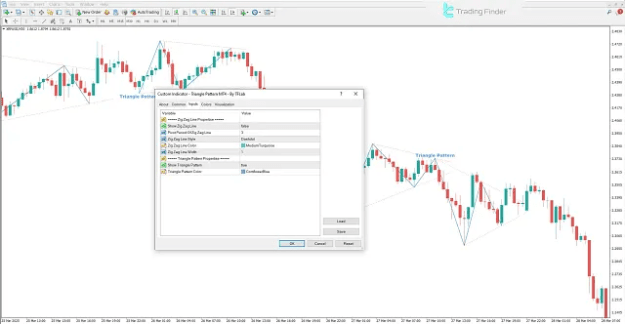
Customizing the Indicator Settings
The Triangle Pattern Indicator offers customizable parameters to fit a trader's specific preferences. The settings panel allows for adjustments to the visual appearance of the indicator's components.
- Show Zig Zag Line: Enables or disables the display of the underlying Zig Zag line, which is used to identify peaks and troughs.
- Pivot Period of Zig Zag Line: Adjusts the sensitivity of the Zig Zag line's pivot points.
- Zig Zag Line Style, Color, and Width: Allows for the customization of the line's visual properties.
- Show Triangle Pattern: A toggle to show or hide the triangle pattern itself.
- Triangle Pattern Color: Changes the fill color of the triangle pattern.
Conclusion
The Triangle Pattern Indicator for MT4 is an effective tool for traders who rely on continuation patterns. It simplifies the process of identifying price consolidation phases, which precede a significant market move. By automatically detecting and drawing these patterns based on peaks, troughs, and trendlines, the indicator provides a clear visual representation of market structure. Its ability to also display potential breakout points with converging trendlines makes it an essential tool for forecasting the next major market move.