https://tradingfinder.com/products/i...free-download/
https://www.forexfactory.com/thread/...-in-metatrader
Prop Firm DrawDown Protector : Prop Firm Capital Protection Expert MT4 |Forex Money Management: Forex Trade Management Expert MT4 |ICT Concepts Indicator MT4 | Smart Money Concepts Expert MT4| Get a free Expert Advisor license via Telegram and WhatsApp
Key Features and Components of the MMI Indicator
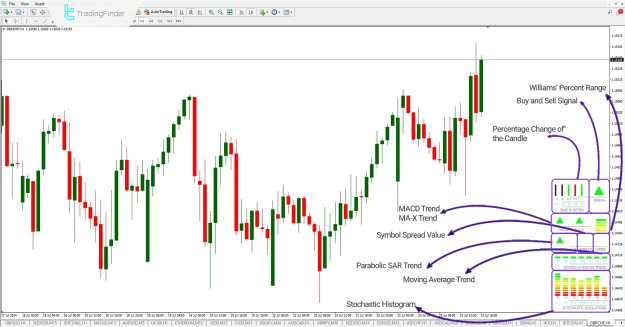
The MMI combines a variety of popular indicators to provide a holistic view of market conditions. Here is a breakdown of the nine indicators included:
- Williams' Percent Range (WPR%): Displays the Williams' Percent Range level as a histogram, helping to identify overbought or oversold conditions.
- Buy and Sell Signal: Generates clear, actionable buy (green up-arrow) and sell (red down-arrow) signals based on a consolidated analysis of all included indicators.
- Bar Chart Meter: Shows the percentage change of the current price relative to the previous four bars, offering insight into short-term momentum.
- MACD: Indicates the direction of the MACD signal line crossing, a key tool for trend following and momentum analysis.
- Moving Average X (MA-X): Reveals the crossing direction of a weighted linear moving average and a simple moving average, providing a unique trend perspective.
- Parabolic SAR (PSAR): Indicates the direction of the Parabolic SAR, which is used to determine trend direction and potential reversals.
- Spread: Displays the real-time difference between the Bid and Ask prices, an essential factor for managing trading costs.
- Moving Average Trend: Shows the overall trend direction of the moving average, helping traders confirm the market's direction.
- Stochastic Oscillator Histogram: Displays the value of the Stochastic Oscillator as a histogram, used to identify overbought and oversold levels.
How to Interpret MMI Signals
The MMI indicator simplifies decision-making by providing clear signals for market entry.
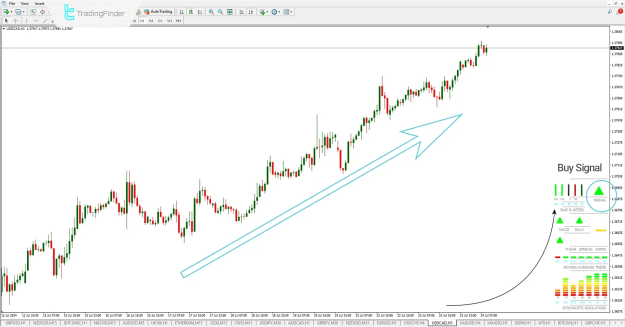
MMI Buy Signal
A buy signal is generated when the MMI's integrated analysis indicates a strong upward momentum. For example, on the USD/CAD 1-hour chart, the MMI might issue a green arrow, prompting a trader to consider entering a long position. This signal is a culmination of data from all nine indicators, providing a high-confidence entry point.
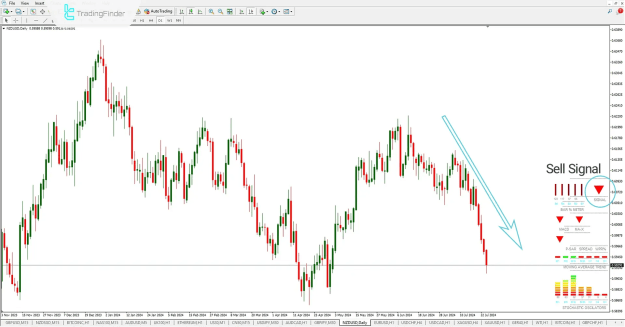
MMI Sell Signal
Conversely, a sell signal is issued when the combined analysis points to a strong downward trend. For instance, on the NZD/USD daily chart, a red arrow from the MMI suggests a potential short entry. This signal helps traders identify potential market reversals or continuations of a downtrend.
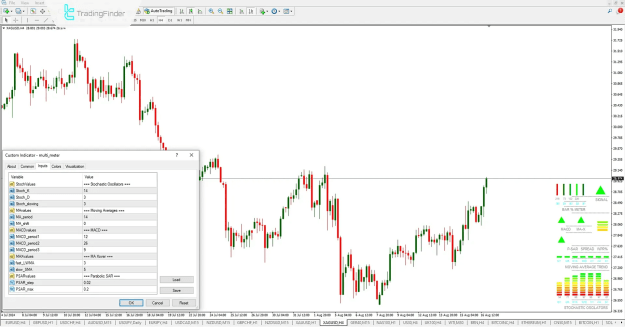
Customizing MMI Indicator Settings
The MMI indicator is highly customizable, allowing traders to fine-tune its parameters to suit their specific trading strategies. These settings can be adjusted on platforms like MT4 for instruments such as stocks, cryptocurrencies, and Forex. Key customizable parameters include:
- Stochastic Oscillator: Adjustments for the K, D, and Slowing values.
- Moving Average: Customizable period and shift values.
- MACD: Settings for the fast, slow, and signal periods.
- Weighted Linear MA and Simple MA: Adjustable periods for the MA-X indicator.
- Parabolic SAR: Control over the step and maximum values.
Conclusion
The Multi Meter Indicator (MMI) is a highly effective tool for traders using MetaTrader 4, as it integrates nine essential volatility and trend indicators into a single, uncluttered display. This consolidation allows for more efficient and precise market analysis, enabling traders to quickly assess the strength of market participants and make more informed decisions. By presenting data from indicators like the MACD, Parabolic SAR, and Stochastic Oscillator in one location, the MMI simplifies the complex task of technical analysis, making it an invaluable asset for day traders, scalpers, and those engaged in intraday trading across various financial instruments, including Forex, cryptocurrencies, and stocks.