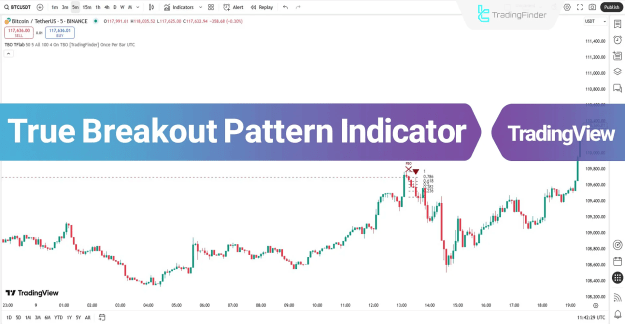
This indicator delivers signals in liquidity sweep areas through colored arrows: green arrows indicate buy opportunities, while red arrows signal sell positions, based on market conditions.
You can access the Indicator from this link:
https://tradingfinder.com/products/i...akout-pattern/
You can access the Indicator on the TradingView website:
https://www.tradingview.com/script/c...nal-Indicator/
Prop Firm DrawDown Protector : Prop Firm Capital Protection Expert MT5 |Forex Money Management: Forex Trade Management Expert MT5 | ICT Concepts Indicator MT5 |Smart Money Concepts Expert MT5 | Smart Money Trap Scanner | Get a free Expert Advisor license via Telegram and WhatsApp
Specifications of the True Breakout Pattern Indicator
The following list details the key specifications of the True Breakout Pattern indicator.
- Indicator Categories: ICT TradingView Indicators, Smart Money TradingView Indicators, Liquidity TradingView Indicators
- Platforms: TradingView Indicators
- Trading Skills: Intermediate
- Indicator Types: Reversal TradingView Indicators, Breakout TradingView Indicators
- Timeframe: Multi-Timeframe TradingView Indicators
- Trading Style: Day Trading TradingView Indicators, Scalper TradingView Indicators, Swing Trading TradingView Indicators
- Trading Instruments: TradingView Indicators in the Forex Market, Cryptocurrency TradingView Indicators, Stock TradingView Indicators
True Breakout Pattern at a Glance
The True Breakout Pattern indicator begins by identifying swing highs and lows, designating them as critical support and resistance levels. A breakout is deemed false if the price re-enters the zone within five candles following the breach.
Following this, if the price pulls back to the 0.618 or 1.0 Fibonacci levels, the indicator produces entry signals.
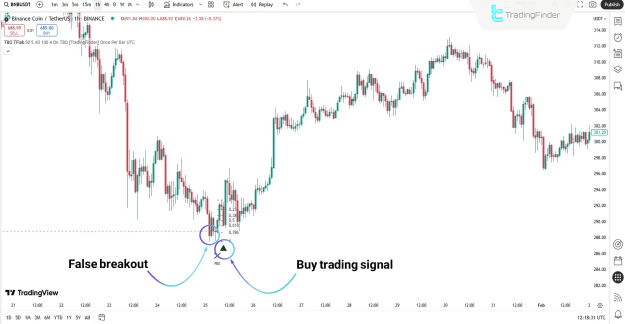
Buy Signal
In the Binance Coin (BNB) chart on a 1-hour timeframe, the price first dips below a swing low but promptly rebounds above it and moves into the Fibonacci retracement area.
As illustrated, upon verification of these conditions, a buy signal emerges, leading to a robust upward trend.
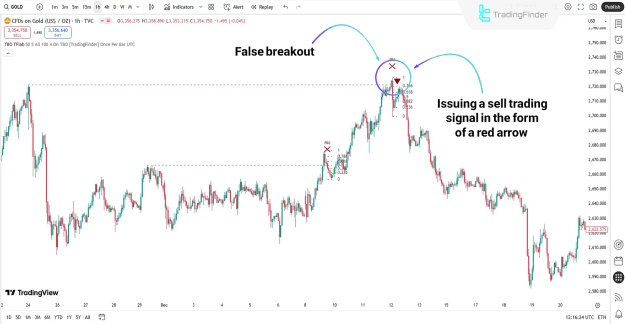
Sell Signal
Examining the Gold chart on a 1-hour timeframe reveals a false breakout above a swing high, followed by a rapid drop below. In such scenarios, a retracement to the 0.618–1.0 Fibonacci levels validates the downward momentum, resulting in a sell signal from the indicator.
True Breakout Pattern Indicator Settings
The configuration options for the True Breakout Pattern indicator are outlined below.
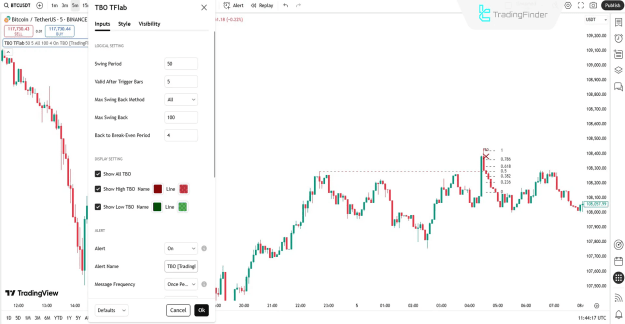
Logical Setting
- Swing Period: The timeframe used to identify swing highs and lows.
- Valid After Trigger Bars: The maximum candle count for validating a breakout after price re-entry.
- Max Swing Back Method: The approach for reviewing all historical swings to determine structural levels.
- Max Swing Back: The quantity of prior swings to evaluate.
- Back to Break-Even Period: The duration for price to revert to the breakout level.
Display Setting
- Show All TBO: Display both valid and invalid breakout patterns on the chart.
- Show High TBO (Name / Line): Exhibit false breakouts at highs, including labels and lines.
- Show Low TBO (Name / Line): Exhibit false breakouts at lows, including labels and lines.
Alert Setting
- Alert: Activate trading notifications from the indicator.
- Alert Name: The designation for alerts generated during configuration.
- Message Frequency: Transmit alerts only once per candle.
Conclusion
The True Breakout Pattern indicator integrates false breakout identification with Fibonacci retracement evaluation, serving as an accurate instrument for eliminating deceptive price actions.
Its adaptable settings enable precise control over functionality. The straightforward visuals and automated notifications streamline trader decision processes.
Applicable across various markets such as cryptocurrencies, stocks, forex, and commodities, this indicator enhances entry precision and mitigates trading risks.