You can access the Indicator from this link:
https://tradingfinder.com/products/i...ai-trendlines/
You can access the Indicator on the TradingView website:
https://www.tradingview.com/script/n...tering-Trends/
Prop Firm DrawDown Protector : Prop Firm Capital Protection Expert MT4 | Forex Money Management: Forex Trade Management Expert MT4 |ICT Concepts Indicator MT4 | Smart Money Concepts Expert MT4| Smart Money Trap Scanner | Get a free Expert Advisor license via Telegram and WhatsApp
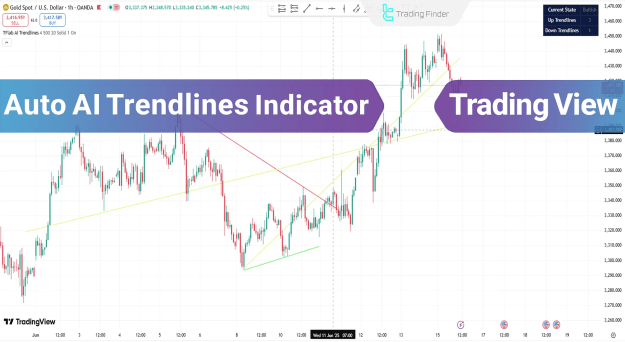
Auto Trendline Drawing
The indicator plots uptrends with green lines and downtrends with red lines, allowing traders to quickly interpret market direction. A dedicated market status panel provides actionable insights for buying during uptrends or selling during downtrends.
- Uptrend lines (Green): Highlight dynamic support levels and potential price growth channels.
- Downtrend lines (Red): Mark moving resistance levels and price decline channels.
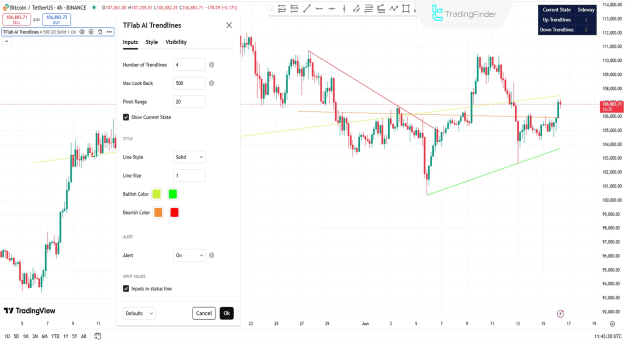
Core Settings and Customization
The Auto AI Trendlines Indicator offers a wide range of settings for precise trend analysis:
- Number of Trendlines: Adjusts how many lines appear on the chart.
- Max Look Back: Defines the candle range for trend calculation.
- Pivot Range: Sets the scope for pivot point evaluation.
- Show Current State: Toggles the real-time market status panel.
Style & Alerts
- Line Style & Size: Customize line appearance and thickness.
- Bullish & Bearish Colors: Default green for uptrends, red for downtrends.
- Alerts: Enable notifications for trend changes.
- Status Line Inputs: Display or hide key input values.
How the Indicator Works
The Auto AI Trendlines Indicator combines dynamic analysis and smart algorithms to detect trends effectively:
- Dynamic Lines: Continuously update according to price movement.
- Static Lines: Highlight key support and resistance levels.
- Real-Time Info Panel: Allows traders to assess current trend direction instantly.
This dual-line system helps traders monitor market structure while tracking short-term fluctuations.
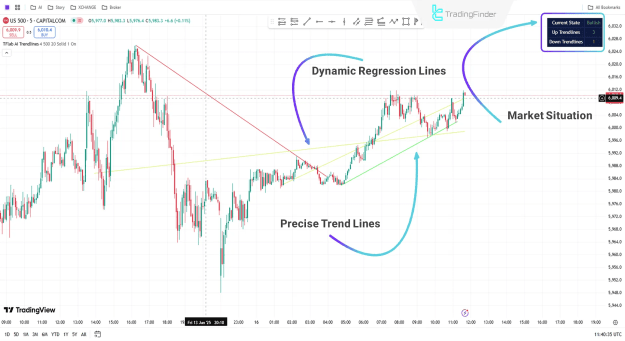
Uptrend Example
On a 5-minute S&P 500 chart, the indicator automatically draws two uptrend lines, signaling a stable bullish trend. Traders can monitor the info panel for real-time analysis and combine insights with other technical indicators to enter buy positions confidently.
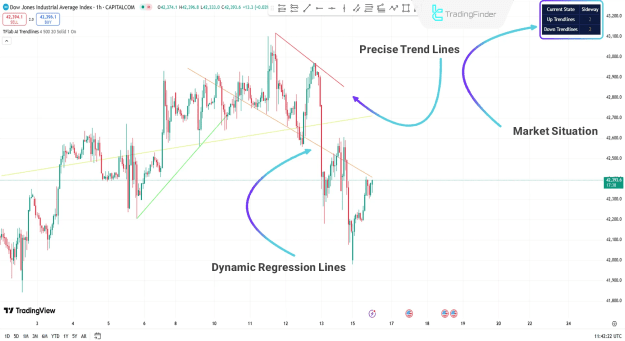
Downtrend Example
On a 1-hour Dow Jones chart, the indicator identifies a downtrend and plots two distinct lines:
- Exact Trendlines: Derived from pivot points and key levels.
- Dynamic Regression Lines: Adapt in real-time to price movements.
Confirmed bearish momentum provides traders with actionable insights for sell positions, maximizing the efficiency of short-term trading strategies.
Conclusion
The Auto AI Trendlines Indicator is an indispensable tool for intraday, day trading, and scalping strategies. By combining multi-timeframe analysis, dynamic trendlines, and market status visualization, traders can make informed decisions and capitalize on both bullish and bearish opportunities in forex, stocks, and indices markets.