You can access the Indicator from this link:
https://tradingfinder.com/products/i...iew/son-model/
You can access the Indicator on the TradingView website:
https://www.tradingview.com/script/z...ep-M15-FVG-M1/
Prop Firm DrawDown Protector : Prop Firm Capital Protection Expert MT5 |Forex Money Management: Forex Trade Management Expert MT5 | ICT Concepts Indicator MT5 |Smart Money Concepts Expert MT5 | Smart Money Trap Scanner |Get a free Expert Advisor license via Telegram and WhatsApp
Indicator Specifications
The Son Model ICT Indicator is a versatile tool suitable for various trading styles and instruments.
- Indicator Categories: It falls under several categories, including ICT TradingView Indicators, Smart Money TradingView Indicators, and Liquidity TradingView Indicators.
- Skill Level: It is best suited for traders with an intermediate skill level, as a solid understanding of ICT concepts is beneficial.
- Indicator Types: This is a lagging indicator that also functions as an entry & exit tool.
- Timeframes & Trading Styles: The indicator is optimized for short-term trading on the M1 to M5 timeframes, making it ideal for intraday trading, day trading, and scalping.
- Trading Instruments: It is effective across a range of financial markets, including the Forex market, stocks, and indices.
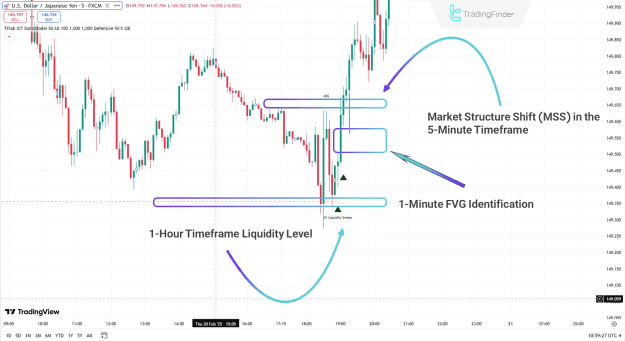
Bullish Trend Identification
In a bullish scenario, the Son Model ICT Indicator provides a clear sequence of events to confirm a trade setup. As seen on a 5-minute USD/JPY chart, the indicator first identifies liquidity accumulation within a higher timeframe (e.g., 5-hour). Following this, a market structure shift to the upside confirms a change in market direction. The price then retraces to an identified fair value gap (FVG), often with a simple shadow or wick, before continuing its upward trajectory. This retest of the FVG serves as the ideal entry point before the bullish trend resumes.
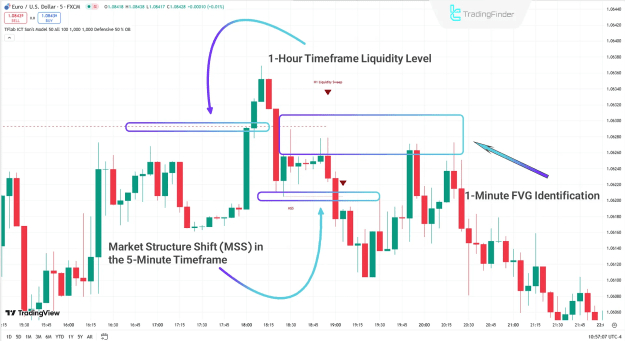
Bearish Trend Identification
Conversely, the indicator can be used to identify high-quality bearish setups. On a 5-minute EUR/USD chart, the process begins with the identification of a liquidity level in a higher timeframe (e.g., 1-hour). After the price accumulates this liquidity, it experiences a sharp downward movement, leading to a market structure shift to the downside. The price subsequently pulls back to the newly created fair value gap (FVG), confirming the setup. The decline begins from this FVG level, allowing traders to enter short positions with high precision.
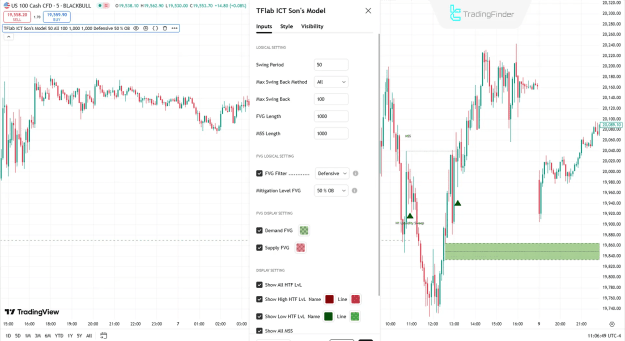
Son Model ICT Indicator Settings
The indicator provides extensive customization options to fine-tune its logic and display.
Logical Settings
- Swing Period: Defines the timeframe used for identifying market swings.
- Max Swing Back Method:
- All: Analyzes all identified swings.
- Custom: Limits the analysis to a specified number of swings.
- Max Swing Back: Sets the number of recent swings to be considered for analysis when "Custom" is selected.
- FVG Length: Determines the validity of a fair value gap based on a specified number of candles.
- MSS Length: Determines the validity of a market structure shift based on a specified number of candles.
FVG Logical Settings
- FVG Filter: This feature allows traders to filter fair value gaps for higher-quality signals.
- Very Aggressive Filter: Checks the highest/lowest price of the last candle for upward/downward FVG.
- Aggressive Filter: Reduces noise by filtering out very small middle candles.
- Defensive Filter: Enhances accuracy by requiring a specific middle candle body size and polarity.
- Very Defensive Filter: Eliminates small doji candles at the beginning and end of the FVG to maintain signal quality.
- Mitigation Level FVG: This setting divides the fair value gap into three distinct levels for a more precise analysis of price consumption.
- Proximal: Considers the closest FVG level to the current price. Price reaching this level invalidates the FVG.
- 50% Level: The midpoint of the FVG range is considered the primary consumption level.
- Distal: Considers the farthest FVG level from the current price. Price reaching this level invalidates the FVG.
FVG Display Settings
- Demand FVG: Toggle the display of bullish fair value gaps.
- Supply FVG: Toggle the display of bearish fair value gaps.
Display Settings
- Show All HTF LvL: Toggle the display of all higher timeframe levels.
- Show High HTF LvL Name: Toggle the display of higher timeframe high level names.
- Show Low HTF LvL Name: Toggle the display of higher timeframe low level names.
- Show All MSS: Toggle the display of all market structure shifts.
- Show High MSS Name: Toggle the display of high MSS names.
- Show Low MSS Name: Toggle the display of low MSS names.
Conclusion
The Son Model ICT Indicator is an advanced tool for traders utilizing liquidity and ICT concepts. It provides a structured methodology for identifying high-probability entry points by confirming three key stages across different timeframes. First, it pinpoints liquidity levels on a higher timeframe (e.g., 1-hour), followed by a confirmation of a market structure shift (MSS) on a lower timeframe (e.g., 5-minute). Finally, the indicator identifies a fair value gap (FVG) on an even lower timeframe (e.g., 1-minute), where a precise entry can be executed. By following these three stages, traders can conduct a more specialized chart analysis and identify superior trading opportunities with the aid of this indicator.