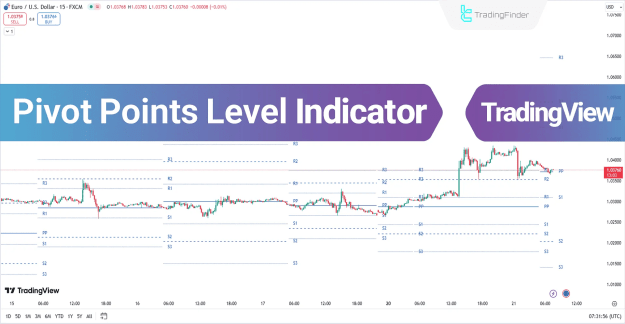
Pivot points are particularly useful for daily analysis and short-term trading strategies, such as scalping or intraday trading on 1-hour, 15-minute, or even 5-minute charts. Traders can also use the TradingFinder pivot point calculator to automate these calculations for more efficient analysis.
You can access the Indicator from this link:
https://tradingfinder.com/products/i...-points-level/
You can access the Indicator on the TradingView website:
https://www.tradingview.com/script/Y...eversal-lines/
Prop Firm DrawDown Protector : Prop Firm Capital Protection Expert MT4 | Forex Money Management: Forex Trade Management Expert MT4 |ICT Concepts Indicator MT4 | Smart Money Concepts Expert MT4| Smart Money Trap Scanner | Get a free Expert Advisor license via Telegram and WhatsApp
Key Features of the Pivot Points Level Indicator
The indicator falls under multiple categories, making it versatile for different trading styles:
Indicator Categories
- Pivot Points & Fractals TradingView Indicators
- Support & Resistance TradingView Indicators
- Liquidity TradingView Indicators
Compatible Platforms
- TradingView Indicators
Recommended Trading Skills
- Intermediate
Indicator Types
- Reversal TradingView Indicators
- Leading TradingView Indicators
Optimal Timeframes
- Daily & Weekly Charts
- M1-M5 (Ultra-Short-Term Trading)
- M15-M30 (Short-Term Trading)
Trading Style Suitability
- Intraday Trading
- Scalping Strategies
Compatible Markets
- Forex Market
- Cryptocurrency Trading
- Indices Trading
Types of Pivot Points in the Indicator
The Pivot Points Level Indicator offers four distinct pivot point calculation methods, each serving unique trading purposes:
1. Floor Pivot Points
The most widely used type, ideal for identifying key support and resistance levels.
2. Camarilla Pivot Points
Consists of eight distinct levels, closely linked to intraday support and resistance zones.
3. Woodie Pivot Points
Similar to Floor Pivot Points but places greater emphasis on the closing price.
4. Fibonacci Pivot Points
Combines Floor Pivot Points with Fibonacci retracement levels, applying them to the previous session’s trading range.
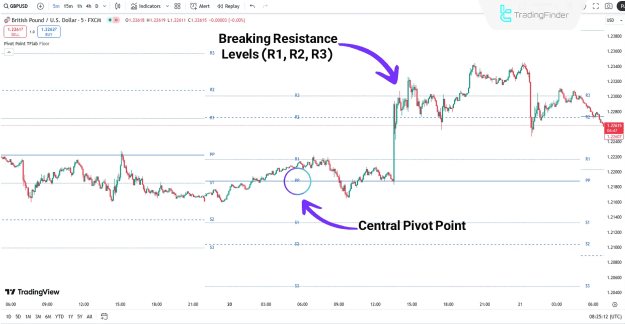
Using Pivot Points in an Uptrend (Bullish Scenario)
In a 5-minute GBP/USD chart, when the price remains above the central pivot (PP), it signals a potential uptrend.
Key Observations:
- After retesting the central pivot (PP), the price often moves toward higher resistance levels (R1, R2, R3).
- Support levels (S1, S2, S3) act as optimal zones for placing stop-loss (SL) orders in bullish trades.
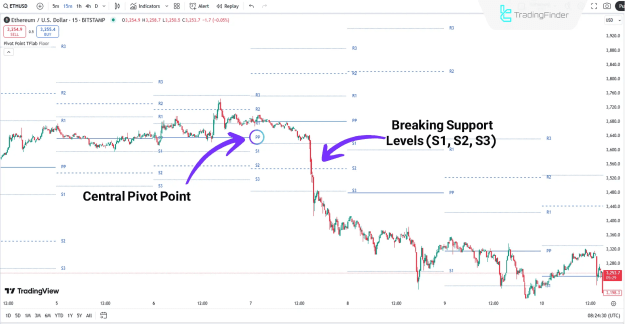
Using Pivot Points in a Downtrend (Bearish Scenario)
In a 15-minute Ethereum (ETH) chart, a price below the central pivot (PP) suggests a downtrend.
Key Observations:
- A sharp break below PP often leads to further declines toward lower support levels (S1, S2, S3).
- Resistance levels (R1, R2, R3) serve as ideal stop-loss (SL) zones in bearish trades.
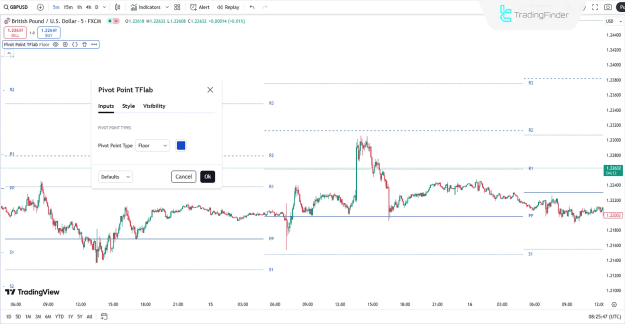
Indicator Settings & Customization
The Pivot Points Level Indicator offers customizable settings in TradingView, allowing traders to adjust:
- Pivot point calculation method (Floor, Camarilla, Woodie, Fibonacci)
- Line colors and styles for better visibility
- Timeframe adjustments for multi-timeframe analysis
Conclusion
The Pivot Points Level Indicator is an essential tool for traders looking to identify trend reversals, support/resistance zones, and liquidity areas. With four different pivot point types, it provides flexibility for various trading strategies, including scalping, intraday trading, and swing trading.
By integrating this indicator into your TradingView charts, you can enhance your technical analysis and make more informed trading decisions across forex, crypto, and indices markets.