Similar to CHoCH (Change of Character) and MSS (Market Structure Shift) indicators, the CISD highlights potential reversal points by detecting breakout events. It provides clear visual signals—green arrows for buy setups and red arrows for sell setups—based on liquidity-driven shifts in market structure.
You can access the indicator from this link:
https://tradingfinder.com/products/i...e-of-delivery/
You can access the indicator on the TradingView website:
https://www.tradingview.com/script/g...r-Liquidity-1/
Prop Firm DrawDown Protector : Prop Firm Capital Protection Expert MT4 | Forex Money Management: Forex Trade Management Expert MT4 |ICT Concepts Indicator MT4 | Smart Money Concepts Expert MT4| Smart Money Trap Scanner | Get a free Expert Advisor license via Telegram and WhatsApp
CISD Indicator Specifications
The Change in State of Delivery (CISD) Indicator belongs to several advanced categories of technical analysis tools:
- ICT TradingView Indicators
- Smart Money TradingView Indicators
- Signal & Forecast TradingView Indicators
Platform: TradingView
Recommended Skill Level: Advanced
Indicator Type: Reversal Indicator
Timeframe Suitability: Multi-Timeframe
Trading Style: Intraday
Market Coverage:
- Forex
- Cryptocurrencies
- Forward Contracts
Overview of the CISD Indicator
The CISD is a hybrid trading indicator that integrates the Swing Failure Pattern (SFP) to detect liquidity zones and potential price reversals. It evaluates the last four candlesticks that contribute to a price swing and liquidity grab. Once liquidity is absorbed, the indicator marks the CISD level and anticipates a reversal.
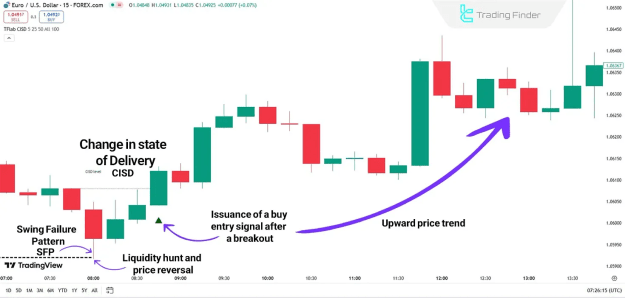
CISD in an Uptrend
In a bullish setup, the indicator identifies liquidity zones where price completes a Swing Failure Pattern. After liquidity is absorbed, a CISD breakout occurs, signaling a reversal to the upside.
Example: On a EUR/USD chart, price taps into liquidity, prints an SFP, and reverses upward. The CISD indicator marks the level and plots a green arrow, confirming a potential long setup.
Key Features:
- Detects liquidity grabs via SFP
- Confirms reversal with a CISD breakout
- Displays buy signals with green arrows
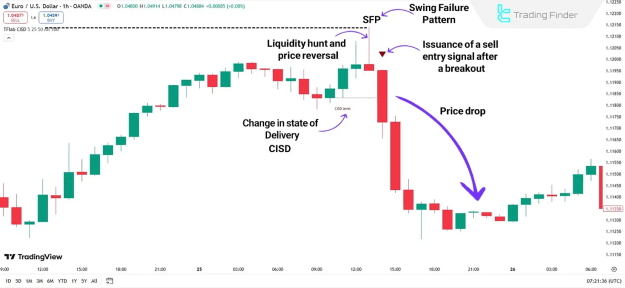
CISD in a Downtrend
In bearish conditions, price often completes false breakouts into liquidity zones during an uptrend before reversing downward. When a CISD breakout forms, the indicator signals the trend shift.
Example: On a chart where price sweeps liquidity to the upside, fails, and reverses, the CISD plots a red arrow, identifying a short opportunity.
Key Features:
- Identifies liquidity grabs in rising markets
- Confirms reversals via bearish CISD formation
- Displays sell signals with red arrows
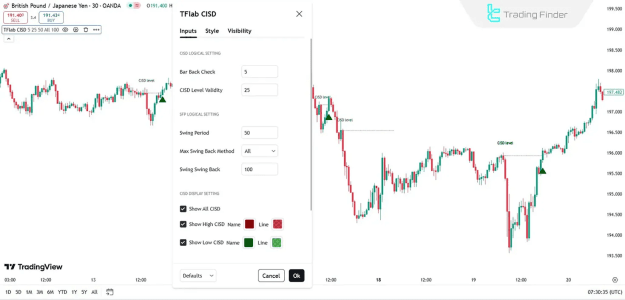
CISD Indicator Settings
The CISD indicator provides both logical configurations and visual display options, giving traders full control over customization.
CISD Logical Settings
- Bar Back Check – Analyzes prior candles to validate structure
- CISD Level Validity – Ensures CISD zones are reliable before signaling
SFP Logical Settings
- Swing Period – Defines the period for detecting major swings
- Max Swing Back Method – Measures maximum retracements to confirm trend direction
CISD Display Settings
- Swing Back – Evaluates pullbacks for trend strength
- Show All CISD – Displays all CISD zones on the chart
- Show High CISD Name – Marks bullish CISD zones in green
- Show Low CISD Name – Marks bearish CISD zones in red
SFP Display Settings
- Show All SFP – Option to plot all Swing Failure Patterns (off by default)
- Show High SFP Name – Displays SFPs at higher price zones
- Show Low SFP Name – Displays SFPs at lower price zones
Conclusion
The Change in State of Delivery (CISD) Indicator is a sophisticated tool aligned with ICT and Smart Money Concepts (SMC) frameworks. By combining market structure analysis with liquidity detection, it delivers precise entry signals in both Forex and crypto markets.
Through its integration of SFP-based liquidity grabs, CISD breakouts, and customizable settings, the indicator enhances market timing and supports informed decision-making for intraday traders. Whether bullish or bearish, the CISD effectively highlights reversal zones and liquidity-driven structural shifts, making it a valuable addition to advanced trading strategies.