Order Blocks represent critical zones on a chart where major financial institutions and high-volume traders have placed a large number of orders. The high concentration of either buy or sell orders in these areas makes them pivotal points for potential price reversals or temporary pauses in a trend.
You can access the Indicator from this link:
https://tradingfinder.com/products/i...-blocks-alert/
You can access the Indicator on the TradingView website:
https://www.tradingview.com/script/D...er-BBOB-Alert/
Prop Firm DrawDown Protector : Prop Firm Capital Protection Expert MT5 |Forex Money Management: Forex Trade Management Expert MT5 | ICT Concepts Indicator MT5 |Smart Money Concepts Expert MT5 | Smart Money Trap Scanner |Get a free Expert Advisor license via Telegram and WhatsApp
BBOB Indicator Specifications
The BBOB indicator is categorized based on its function and application in trading.
- Indicator Categories: ICT Tradingview Indicators, Support & Resistance Tradingview Indicators, Liquidity Tradingview Indicators
- Platforms: TradingView Indicators
- Trading Skills: Advanced
- Indicator Types: Reversal Tradingview Indicators, Multi-Timeframe Tradingview Indicators
- Trading Style: Intraday Tradingview Indicators
- Trading Instruments: Forex Market, Cryptocurrency, Stocks, Commodities
Overview of the Indicator
The indicator visually distinguishes between two types of overlapping blocks to signify market pressure. Demand-overlapping blocks, displayed in blue, indicate zones of strong buying pressure and a high probability of an upward price reversal. Conversely, supply-overlapping blocks, shown in orange, signal strong selling pressure and a potential decline in price.
By combining the concepts of Order Blocks and Breaker Blocks, the BBOB Indicator illuminates crucial trading areas, helping traders identify optimal entry and exit points.
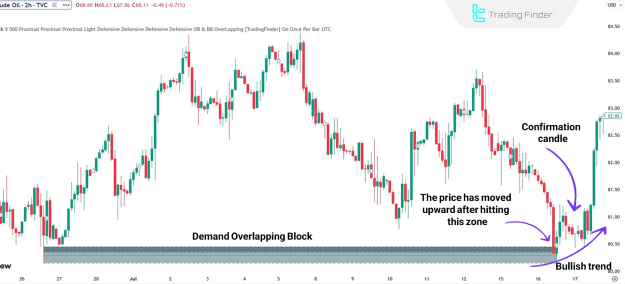
BBOB Indicator in a Bullish Trend
In a bullish scenario, a Demand-Overlapping Block forms, often initiating a strong upward trend. Due to the high volume of orders and liquidity, this zone functions as a powerful support level. When the price returns to this zone, it typically absorbs the available liquidity and continues its upward movement. For example, on a Crude Oil (WTI) price chart, the formation of a Demand-Overlapping Block can precede and support a significant bullish rally.
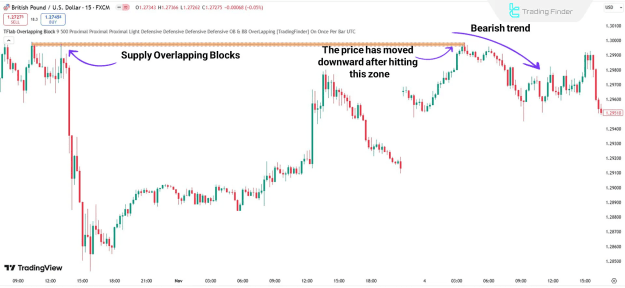
BBOB Indicator in a Bearish Trend
In a bearish scenario, a Supply-Overlapping Block forms. The price may initially gather liquidity from this zone before experiencing a sharp decline. When the price revisits this zone, the selling pressure may be less intense, but the zone typically remains a valid resistance level. An example of this can be observed on a GBP/USD currency pair chart, where a Supply-Overlapping Block formation can lead to a sustained downward trend.
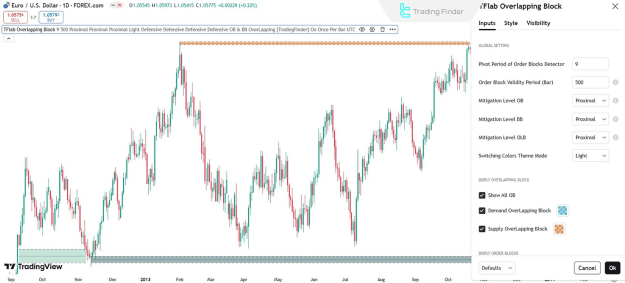
BBOB Indicator Settings
The BBOB indicator offers a range of customizable settings to fine-tune its performance and visual display.
- Pivot Period of Order Blocks Detector: Sets the pivot period for detecting order blocks (e.g., 9).
- Order Block Validity Period (Bar): Determines the duration for which order blocks remain valid (e.g., 500 candles).
- Mitigation Levels: Specific settings for mitigation levels for Order Blocks (OB), Breaker Blocks (BB), and Overlapping Blocks (OLB).
- Color Theme Mode: Allows selection of a color theme (e.g., Light).
- Visibility Options: Toggles the display of various blocks, including all Order Blocks (OB), Demand Overlapping Blocks, Supply Overlapping Blocks, and different types of Breaker Blocks (BB).
- Refinement Settings: Enables "Defensive mode" for refining main and sub-demand and supply blocks.
- Alerts: Configures alerts for specific events, such as the mitigation of overlapping OB and BB zones, with customizable alert names and message content.
Conclusion
The BBOB Indicator is an advanced analytical tool rooted in the ICT trading methodology. It is designed to automatically detect and highlight the intersection of Order Blocks and Breaker Blocks. By identifying these critical market levels, including supply and demand zones, the indicator helps traders evaluate price behavior and anticipate potential market reversals in these key overlapping areas.