Key Features of the XAMD/AMDX Indicator
- ICT & Smart Money-Based Analysis
- Multi-Timeframe Compatibility
- Works Across Forex, Crypto, Stocks, Commodities, and Indices
- Advanced Reversal & Continuation Signals
You can access the Indicator from this link:
https://tradingfinder.com/products/i.../xamd-amdx-01/
You can access the Indicator on the TradingView website:
https://www.tradingview.com/script/6...Theory-Cycles/
Prop Firm DrawDown Protector : Prop Firm Capital Protection Expert MT5 |Forex Money Management: Forex Trade Management Expert MT5 | ICT Concepts Indicator MT5 |Smart Money Concepts Expert MT5 | Smart Money Trap Scanner |Get a free Expert Advisor license via Telegram and WhatsApp
How the XAMD/AMDX Indicator Works
The XAMD/AMDX strategy segments market movements into four critical phases, each with unique price behaviors:
1. Accumulation Phase
- Market remains calm with minimal volatility.
- Institutional traders (Market Makers) accumulate positions.
- Sets the foundation for the next major move.
2. Manipulation Phase
- Fake breakouts occur to trigger stop losses.
- Retail traders often get trapped in false moves.
- Prepares the market for the dominant trend.
3. Distribution Phase
- The primary trend of the day emerges.
- Sharp price movements due to large institutional transactions.
- High momentum drives the market direction.
4. Continuation or Reversal Phase
- Determines whether the trend will continue or reverse.
- Provides critical signals for entry and exit points.
XAMD/AMDX Indicator in Action
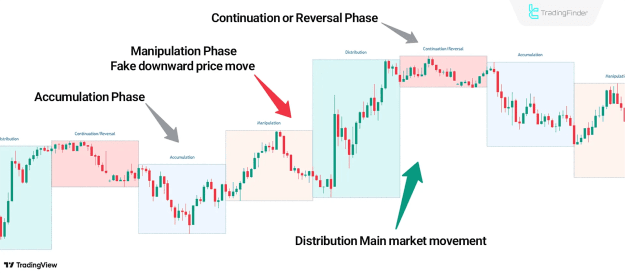
Bullish Trend Example (USD/JPY - 30M Timeframe)
- During the manipulation phase, a fake downward move lures sellers.
- Once the distribution phase begins, the true bullish trend emerges.
- Traders can capitalize on the upward momentum after the fakeout.
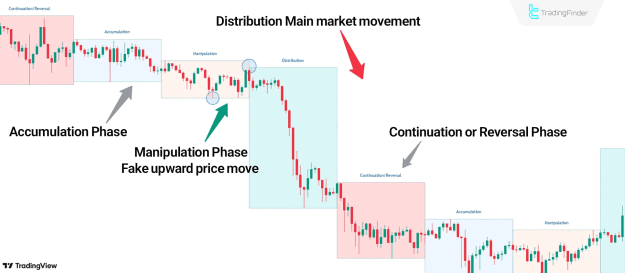
Bearish Trend Example (ETH/USD - 15M Timeframe)
- The manipulation phase shows a fake upward breakout.
- As the distribution phase starts, the dominant bearish trend takes over.
- Short sellers benefit from the downward continuation.
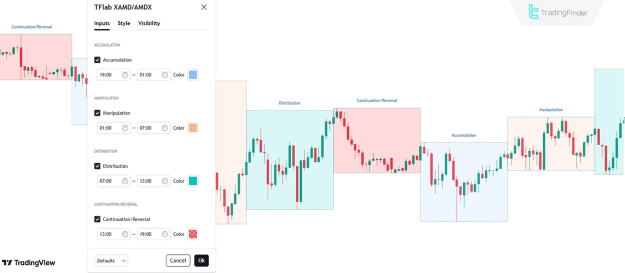
Indicator Settings & Customization
The XAMD/AMDX [01] Indicator offers adjustable parameters for each phase:
- Accumulation Settings: Fine-tune detection of accumulation zones.
- Manipulation Settings: Adjust sensitivity to fake breakouts.
- Distribution Settings: Optimize for trend strength identification.
- Reversal/Continuation Settings: Enhance reversal confirmation signals.
Conclusion
The XAMD/AMDX Quarterly Theory Cycle Indicator provides traders with a structured approach to market analysis by breaking down price action into four strategic phases. By understanding these phases, traders can:
- Avoid fakeouts and false breakouts.
- Align with institutional moves (Smart Money).
- Improve entry & exit precision in Forex, Crypto, Stocks, and more.
For traders seeking advanced liquidity-based strategies, this TradingView indicator is a powerful tool for high-probability trading setups.