These patterns typically form at the end of bullish or bearish trends, signaling a possible shift in market direction. Whether you trade forex, commodities, or indices, this indicator enhances your strategy by highlighting critical reversal opportunities.
You can access the Indicator from this link:
https://tradingfinder.com/products/i...l-candlestick/
You can access the Indicator on the TradingView website:
https://www.tradingview.com/script/C...rend-Patterns/
Prop Firm DrawDown Protector : Prop Firm Capital Protection Expert MT5 |Forex Money Management: Forex Trade Management Expert MT5 | ICT Concepts Indicator MT5 |Smart Money Concepts Expert MT5 | Smart Money Trap Scanner |Get a free Expert Advisor license via Telegram and WhatsApp
Key Reversal Candlestick Patterns Detected
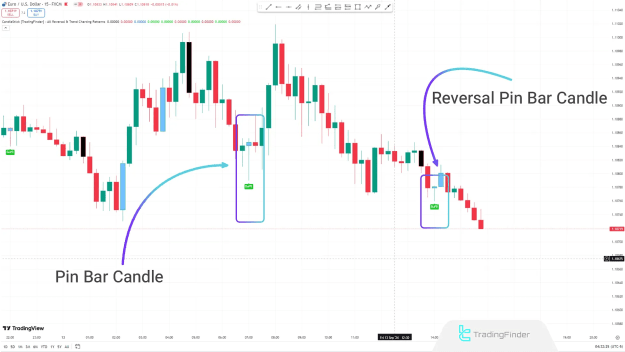
1. Pin Bar Reversal Pattern
Example: 15-minute chart of EUR/USD
The Pin Bar is a strong reversal pattern characterized by a small body and a long wick, indicating a potential trend change. The longer the wick, the higher the probability of a significant reversal.
- Bullish Pin Bar: Forms at the end of a downtrend, suggesting upward momentum.
- Bearish Pin Bar: Appears after an uptrend, signaling a potential decline.
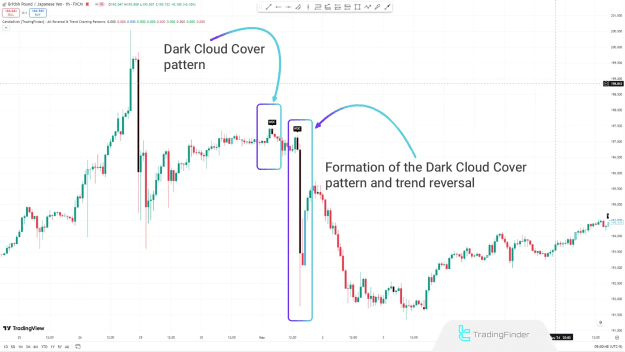
2. Dark Cloud Cover Pattern
Example: 1-hour chart of GBP/JPY
The Dark Cloud Cover is a bearish reversal pattern that emerges after an uptrend. It consists of a bullish candle followed by a bearish candle that closes below the midpoint of the previous candle.
- Indicates selling pressure and a possible downtrend continuation.
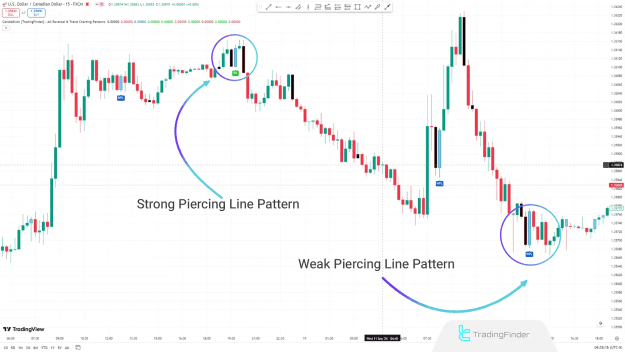
3. Piercing Line Pattern
Example: 15-minute chart of USD/CAD
The Piercing Line is a bullish reversal pattern formed by two candles:
- A bearish candle at the end of a downtrend.
- A bullish candle covering at least 50% of the previous candle’s body.
- Weak Piercing Line (WPL): Less than 50% coverage.
- Strong Piercing Line (SPL): More than 50% coverage, indicating a stronger reversal.
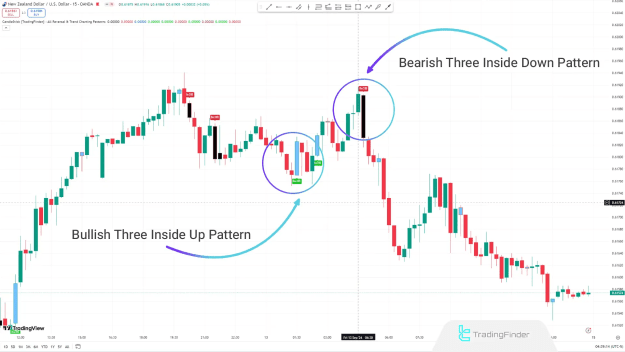
4. 3 Inside Bar Reversal Pattern
Example: 15-minute chart of NZD/USD
The 3 Inside Bar pattern consists of three candles and appears at trend extremes:
- Bullish 3 Inside Bar (Bu3Lb):
- First candle: Bearish.
- Second candle: Smaller, within the first candle’s range.
- Third candle: Strong bullish candle covering >50% of the first candle’s body.
- Bearish 3 Inside Bar (Be3Lb):
- First candle: Bullish.
- Second candle: Smaller, within the first candle’s range.
- Third candle: Strong bearish candle covering >50% of the first candle’s body.
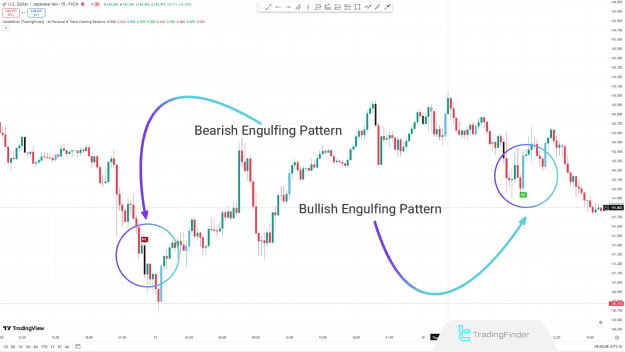
5. Engulfing Pattern
Example: 15-minute chart of USD/JPY
The Engulfing pattern is a strong reversal signal formed by two candles:
- Bullish Engulfing (BuE):
- First candle: Bearish.
- Second candle: Large bullish candle completely engulfing the previous candle’s body.
- Signals a potential uptrend reversal.
- Bearish Engulfing (BeE):
- First candle: Bullish.
- Second candle: Large bearish candle completely engulfing the previous candle’s body.
- Indicates a possible downtrend reversal.
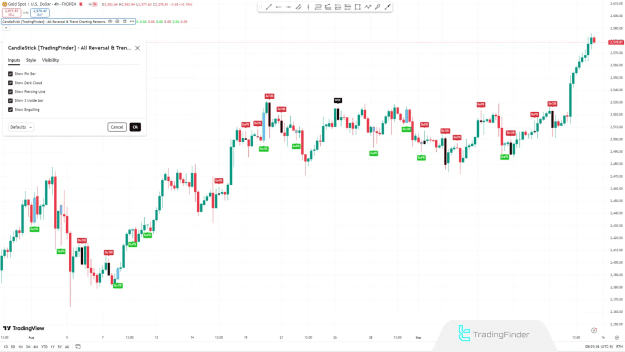
Customizable Indicator Settings
The Reversal Candlestick Pattern Indicator allows traders to enable or disable specific patterns based on their strategy:
- Show/Hide Pin Bar
- Show/Hide Dark Cloud
- Show/Hide Piercing Line
- Show/Hide 3 Inside Bar
- Show/Hide Engulfing Pattern
This flexibility ensures traders focus only on the most relevant signals for their trading style.
Who Can Benefit from This Indicator?
- Trading Styles:
- Intraday Traders
- Day Traders
- Scalpers
- Markets:
- Forex (EUR/USD, GBP/JPY, USD/CAD, etc.)
- Commodities (Gold, Oil, etc.)
- Indices (S&P 500, NASDAQ, etc.)
- Skill Level:
- Beginner to Advanced Traders
Conclusion
The Reversal Candlestick Pattern Indicator is an essential TradingView tool for traders seeking to identify trend reversals with precision. By detecting Pin Bars, Engulfing Patterns, 3 Inside Bars, Piercing Lines, and Dark Cloud Covers, this indicator provides actionable insights to optimize entry and exit strategies.