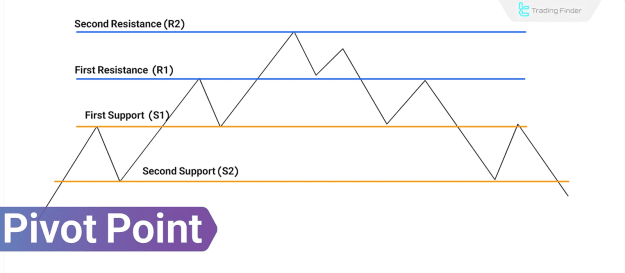
These levels help traders anticipate market behavior by identifying zones where price reversals or breakouts are likely to occur. Due to their objectivity and repeatability, Pivot Points are favored by day traders, scalpers, and algorithmic trading systems for defining entry, exit, and risk management levels.
TP & SL Tool: Risk Reward Ratio Calculator RRR MT5 | Prop Firm Protector: Trade Assist Prop Firm Plus TF Expert MT5 | Money Management + DrawDown Protector: Trade Panel Prop Firm Drawdawn Limiter Pro MT5 |Get a free Expert Advisor license via Telegram and WhatsApp
What Is a Market Pivot Point?
A Pivot Point represents a central price level calculated as the average of the previous day's high, low, and close. It is used as a benchmark for market sentiment:
- Above the Pivot Point: Indicates a bullish bias.
- Below the Pivot Point: Suggests bearish sentiment.
The Pivot Point acts as a foundation for calculating support and resistance levels, which are zones where price often reacts, pauses, or reverses. These levels help traders define:
- Entry and exit positions
- Stop-loss placements
- Take-profit targets
How to Calculate a Pivot Point
Pivot Points are derived from the following three components of the previous trading day:
- High: The highest price
- Low: The lowest price
- Close: The final trading price
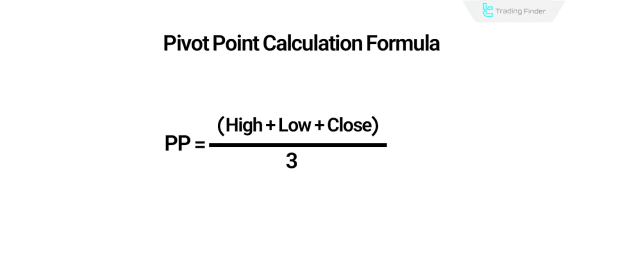
Pivot Point Formula:
Pivot Point (PP) = (High + Low + Close) ÷ 3
This central value serves as the reference level for calculating support and resistance zones.
Tip: Use the TradingFinder Pivot Point Calculator Tool for instant calculations.
Calculating Resistance Levels in Pivot Point Analysis
Resistance levels represent zones where bullish momentum may weaken, making them ideal for taking profits or initiating short positions.
- R1 = (2 × PP) − Low
- R2 = PP + (High − Low)
- R3 = High + 2 × (PP − Low)
Calculating Support Levels in Pivot Point Analysis
Support levels are zones where buying interest increases, often halting or reversing a bearish trend.
- S1 = (2 × PP) − High
- S2 = PP − (High − Low)
- S3 = Low − 2 × (High − PP)
Different Methods of Pivot Point Calculation
There are several variations of Pivot Point calculations tailored to different market conditions and trading styles. Below are the most common ones:
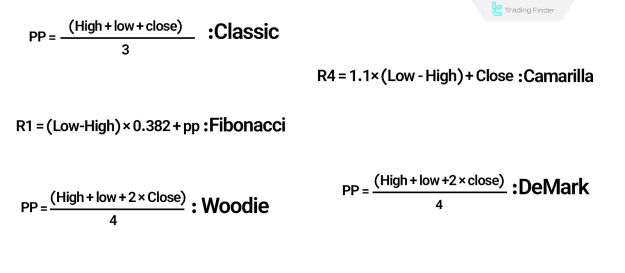
Standard Pivot (Classic Method)
The most commonly used technique. It takes the average of the high, low, and close to define a central level:
- Pivot Point (P) = (High + Low + Close) ÷ 3
This method serves as a simple reference for determining market pressure zones.
Fibonacci Pivot
A variation of the classic pivot point that incorporates Fibonacci retracement ratios to define support and resistance.
Resistance Levels:
- R1 = PP + 0.382 × (High − Low)
- R2 = PP + 0.618 × (High − Low)
- R3 = PP + 1.000 × (High − Low)
Support Levels:
- S1 = PP − 0.382 × (High − Low)
- S2 = PP − 0.618 × (High − Low)
- S3 = PP − 1.000 × (High − Low)
Woodie Pivot
This method places greater emphasis on the closing price, making it more sensitive to recent market action:
- PP = (High + Low + 2 × Close) ÷ 4
Camarilla Pivot
Used primarily for intraday trading and volatile markets, this method uses fixed multipliers to generate four support and four resistance levels.
Example Resistance Formula:
- R4 = 1.1 × (Close − Low) + Close
DeMark Pivot
DeMark Pivot differs by incorporating the relationship between the previous day's close and open. It adjusts the high and low accordingly:
- PP = (High + Low + 2 × Close) ÷ 4
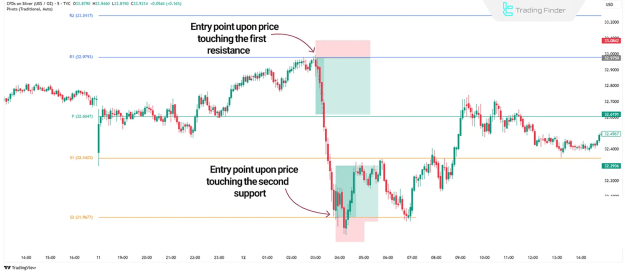
Practical Applications of Pivot Points in Trading
Pivot Points offer a structured and repeatable approach to technical trading by defining important reaction levels. Common use cases include:
Entry and Exit Points
Support and resistance levels generated from Pivot Points often act as decision zones where price either reverses or continues. Traders adjust their strategies based on how price behaves at these levels.
Setting Take-Profit and Stop-Loss
- Resistance levels (R1, R2) and support levels (S1, S2) are ideal for defining take-profit zones.
- Stop-loss orders are usually set just beyond these levels to minimize risk in case of breakouts.
Market Direction Analysis
The position of the current price in relation to the Pivot Point helps assess market sentiment:
- Above PP: Bullish market bias
- Below PP: Bearish market bias
This assessment aids in filtering trade setups.
Combination with Other Indicators
Pivot Points gain enhanced precision when combined with technical indicators such as:
- RSI (Relative Strength Index)
- MACD (Moving Average Convergence Divergence)
- Moving Averages
Example: If an RSI divergence occurs near R2 or an MA crossover aligns with a Pivot Point level, the signal's strength is validated.
Conclusion
Pivot Points are objective, repeatable tools that utilize past price data to forecast key market levels. Whether using the Standard, Fibonacci, Woodie, Camarilla, or DeMark methods, these calculations offer crucial insight into potential reversals, breakouts, and trend continuations.
When combined with confirmation indicators and lower timeframe structures, Pivot Points significantly enhance trade accuracy and risk management in both manual and automated trading systems.