This indicator is particularly effective for identifying highly volatile currency pairs, especially during the London trading session, although it remains effective in other sessions as well. Its simple interface and practical design enable users to detect trend continuations or reversals without the need for advanced technical analysis expertise.
The Xmaster Formula is suitable for scalping, short-term, and medium- to long-term trading strategies.
Xmaster Formula Indicators:
Xmaster Formula Indicator MT4
Xmaster Formula Indicator MT5
TP & SL Tool: Risk Reward Ratio Calculator RRR MT4 | Prop Firm Protector: Trade Assist Prop Firm Plus TF Expert MT4 | Money Management + DrawDown Protector: Trade Panel Prop Firm Drawdawn Limiter Pro MT4 |Get a free Expert Advisor license via Telegram and WhatsApp
Definition of the Xmaster Formula Indicator
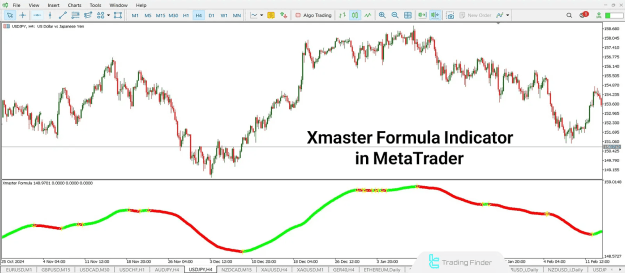
The Xmaster Formula Indicator is a multi-algorithmic tool that analyzes price action using various technical indicators. It combines elements such as the Moving Average (MA), MACD, and Bollinger Bands to identify key support and resistance zones, trend direction, and possible reversal areas.
Despite its advanced internal structure, it is designed for ease of use. The indicator is adaptable to any timeframe and is compatible with different financial markets.
Key Features of the Xmaster Formula Indicator
- Suitable for both major and minor currency pairs
- Optimal performance during the London session; also usable in the New York session
- Effective across short-term and long-term timeframes
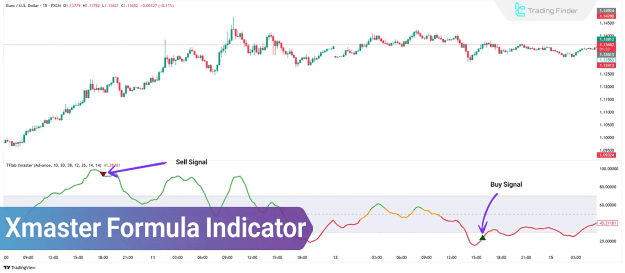
- Provides clear visual signals (Green = Buy, Red = Sell)
- Applicable for scalping, day trading, and swing trading
- Offers overbought and oversold signal detection with visual representation on the chart
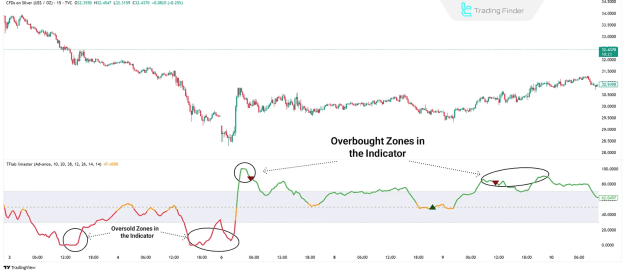
Overbought and Oversold Detection
A key function of the Xmaster Formula Indicator is its ability to identify overbought and oversold conditions in the market.
- A red signal at the top of the chart indicates an overbought zone, signaling a potential price correction or downtrend.
- A green signal at the bottom of the chart indicates an oversold zone, pointing to a possible upward movement.
These signals help traders forecast market reversals with greater accuracy.
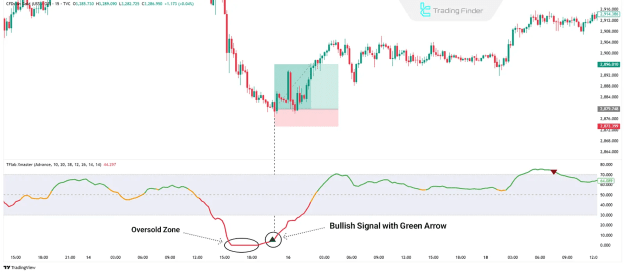
Buy Trade Conditions Using Xmaster Formula
To enter a buy position using the Xmaster Formula Indicator, the following conditions should be met:
- A green arrow appears on the chart
- The indicator line is located within the oversold zone
- A bullish candlestick pattern confirms the buy signal
- Place a stop loss below the candlestick that triggered the signal
- Consider closing the position if the line turns yellow or price reaches a resistance level
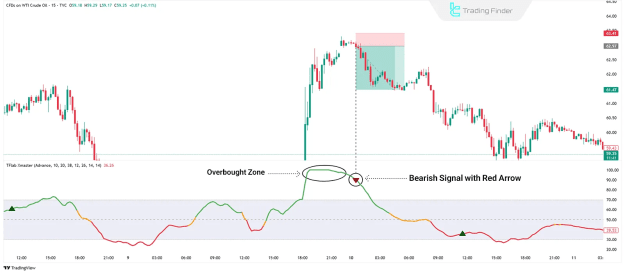
Sell Trade Conditions Using Xmaster Formula
For initiating a sell position, follow these rules:
- A red arrow appears on the chart
- The indicator line is located in the overbought zone
- A bearish candlestick strengthens the validity of the signal
- Set the stop loss above the signal candlestick
- Exit the trade when the arrow color changes or the price hits support
Pros and Cons of the Xmaster Formula Indicator
Pros:
- Simple and easy-to-use interface
- Designed for novice and experienced traders
- Delivers a high percentage of accurate signals
- Can be integrated into various trading strategies
- Ideal for trading major currency pairs
Cons:
- Generates limited signal frequency
- Requires additional confirmation with other indicators
- May produce false signals
- Demands patience in signal waiting periods
Installation Guide for MetaTrader Platforms
To install the Xmaster Formula Indicator on MetaTrader:
- Download the installation file for MT4 or MT5
- Launch MetaTrader
- Go to: File > Open Data Folder > MQL > Indicators
- Copy the indicator file into the Indicators folder
- Restart MetaTrader
- Add the indicator from the Custom Indicators list to your chart
- Adjust settings according to your trading preferences
Installation steps are identical for both MetaTrader 4 (MT4) and MetaTrader 5 (MT5) platforms.
Conclusion
The Xmaster Formula Indicator is a comprehensive tool for detecting price trends and understanding market sentiment. With an easy-to-understand visual interface and compatibility across TradingView, MetaTrader 4, and MetaTrader 5, it is well-suited for both novice and professional traders.
While effective on its own, it is highly recommended to use it in conjunction with additional technical tools such as Bollinger Bands or Fibonacci retracement to strengthen buy and sell signals.