TP & SL Tool: Risk Reward Ratio Calculator RRR MT5 | Prop Firm Protector: Trade Assist Prop Firm Plus TF Expert MT5 | Money Management + DrawDown Protector: Trade Panel Prop Firm Drawdawn Limiter Pro MT5 |Get a free Expert Advisor license via Telegram and WhatsApp
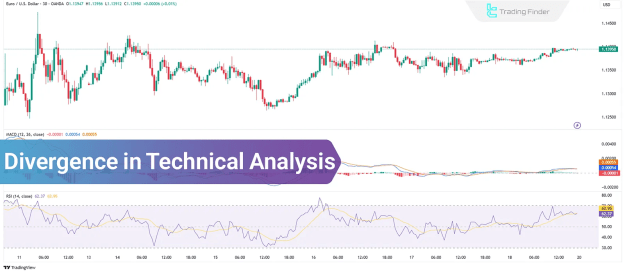
What is Divergence in Technical Analysis?
Divergence occurs when the price of an asset moves in one direction while a technical indicator—such as the RSI, MACD, Stochastic Oscillator, or CCI—moves in the opposite direction. This mismatch often indicates a loss of momentum in the prevailing trend, serving as an early warning of a possible trend reversal or slowdown.
Key Characteristics:
- Highlights trend weakening or potential reversals
- Offers early entry or exit signals
- Frequently used with oscillators like RSI, MACD, or Stochastic
Types of Divergence in Technical Analysis
Divergence can be categorized into two primary types:
Regular Divergence
Regular divergence signals a potential reversal in the trend direction and typically appears at the end of a trend.
- Bearish Divergence:
- Price forms a higher high
- Indicator forms a lower high
- Suggests a downward reversal
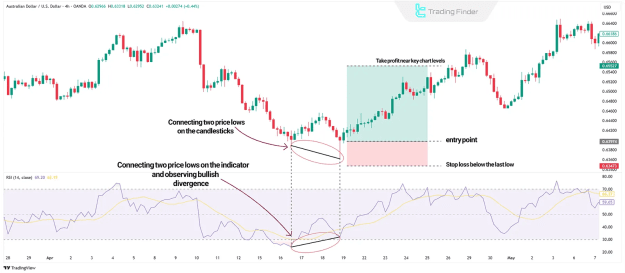
- Bullish Divergence:
- Price forms a lower low
- Indicator forms a higher low
- Indicates a potential upward reversal
This type of divergence is often interpreted as a sign of trend exhaustion.
Hidden Divergence
Hidden divergence, unlike regular divergence, signals trend continuation rather than reversal. It typically emerges during market pullbacks or corrections.
- Bullish Hidden Divergence:
- Price makes a higher low
- Indicator makes a lower low
- Suggests the uptrend is likely to continue
- Bearish Hidden Divergence:
- Price makes a lower high
- Indicator makes a higher high
- Suggests continuation of a downtrend
How to Trade with Divergence
Trading with divergence requires a methodical approach that involves both confirmation and risk control.
Step 1: Identify the Divergence
- Use oscillators like RSI, MACD, or Stochastic
- Compare the highs and lows of price with those of the indicator
Step 2: Confirm the Signal
- Validate divergence using complementary tools such as:
- Candlestick patterns
- Support and resistance levels
- Trendlines
- Fibonacci retracements
Step 3: Execute the Trade
- For Bullish Divergence: Consider a long (buy) position
- For Bearish Divergence: Consider a short (sell) position
Step 4: Apply Risk Management
- Set stop-loss orders below/above recent swing points
- Define take-profit targets based on technical levels and Fibonacci extensions
Divergence in Forex and Other Markets
Divergence is especially prevalent in Forex trading, where price action and momentum analysis play a significant role. It helps traders anticipate reversals in currency pairs with high accuracy. Apart from Forex, divergence is also widely used in:
- Stock markets
- Cryptocurrency trading
- Commodity markets
Due to its universal applicability, divergence is a favored tool among technical traders across various asset classes.
Conclusion
Divergence is an essential component of technical analysis, providing insights into potential trend reversals and continuation patterns. By incorporating indicators such as RSI, MACD, or Stochastic and combining them with price action tools, traders can enhance their decision-making and timing in the markets. It is especially effective in Forex trading, where understanding momentum shifts is crucial for successful trade execution.