TP & SL Tool: Risk Reward Ratio Calculator RRR MT5 | Prop Firm Protector: Trade Assist Prop Firm Plus TF Expert MT5 | Money Management + DrawDown Protector: Trade Panel Prop Firm Drawdawn Limiter Pro MT5 |Get a free Expert Advisor license via Telegram and WhatsApp
Key Characteristics of the Broadening Formation
- Typically emerges after a consolidation phase.
- Price breaks one side of the range, retraces, then breaks the opposite side, repeating the process.
- Reflects institutional liquidity grabs (buy-side and sell-side liquidity).
How to Identify the Broadening Formation
Traders can spot this pattern using two primary methods:
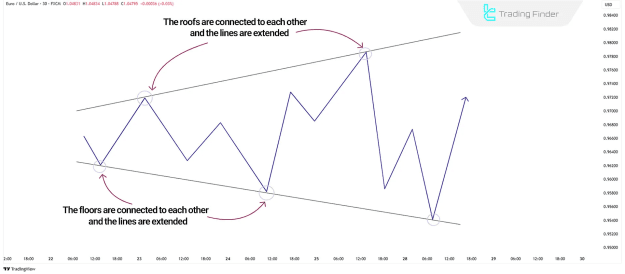
1. Drawing Key Highs and Lows
- Identify the highest high and lowest low in the structure.
- Connect successive highs and extend the trendline upward.
- Connect successive lows and extend the trendline downward.
- The resulting expanding channel confirms the Broadening Formation.
2. Using Buy-Side and Sell-Side Liquidity
- Buy-side liquidity is absorbed when price breaks previous highs.
- Sell-side liquidity is absorbed when price breaks previous lows.
- The pattern forms as price oscillates between these liquidity zones.
Trading Strategies with the Broadening Formation
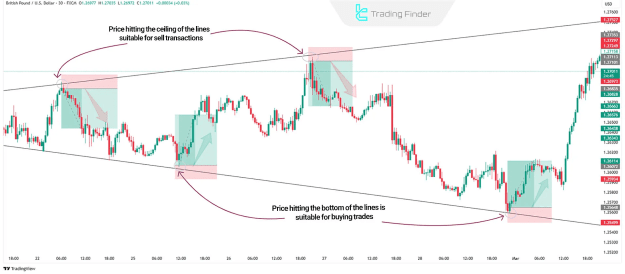
1. Entry and Exit Points
- Short trades near the upper boundary when price shows rejection (e.g., bearish candlestick patterns).
- Long trades near the lower boundary when price shows strength (e.g., bullish reversals).
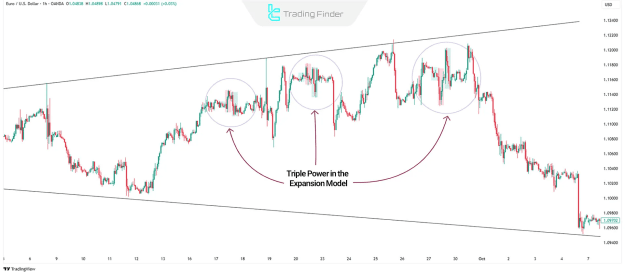
2. Multi-Timeframe Analysis
- The pattern appears across all timeframes (e.g., 15M, 1H, Daily).
- Smaller formations within larger ones create nested patterns, offering confluence.
3. Combining with ICT Concepts
- SMT (Smart Money Technique) Divergence
- Confirms reversals at pattern boundaries.
- Power of Three (Accumulation, Manipulation, Distribution)
- Accumulation: Price consolidates.
- Manipulation: False breakouts occur.
- Distribution: Price reverses sharply.
- Liquidity and Support/Resistance
- Key levels help identify take-profit zones and stop-loss placement.
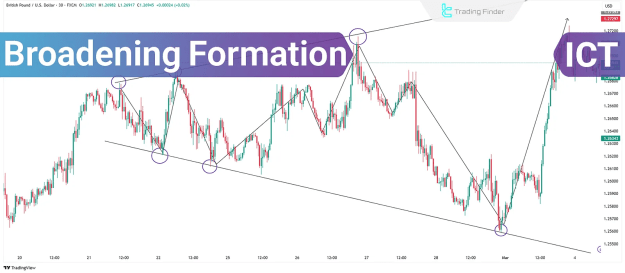
Practical Example: Trading the Broadening Formation
Chart: GBP/USD (30-minute timeframe)
- Pattern Recognition: Price forms higher highs and lower lows.
- Entry Signal:
- Short near the upper trendline after a bearish rejection.
- Long near the lower trendline after a bullish reversal.
- Exit Strategy:
- Target the opposite boundary or use Fibonacci extensions.
Conclusion
The Broadening Formation is a powerful tool for traders anticipating volatility expansion. By combining it with ICT concepts like liquidity analysis, SMT, and Power of Three, traders enhance their precision in identifying high-probability setups.
Mastering this pattern allows traders to capitalize on institutional liquidity movements and improve their risk-reward efficiency.