In institutional trading (Smart Money) and ICT methodologies, liquidity also represents stop-loss activation zones—areas where retail traders' stop orders cluster, triggering algorithmic reactions, a key concept in advanced forex education.
Types of Liquidity in Forex
Forex liquidity is categorized into four key types, essential for order flow analysis and price movement prediction:
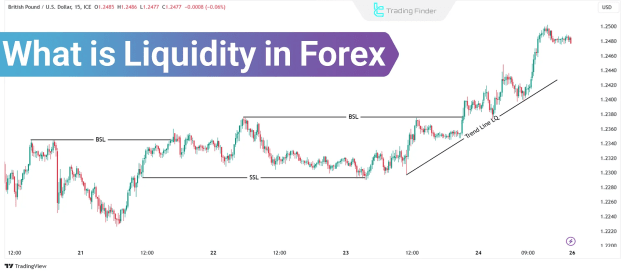
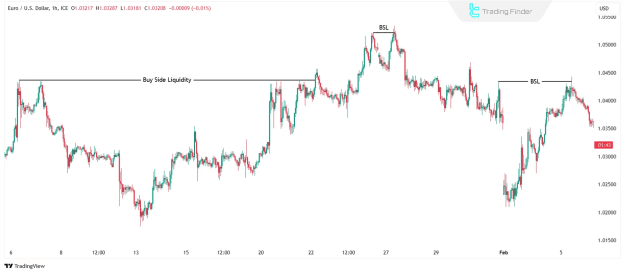
1. Buy-Side Liquidity (BSL)
- Consists of buy-stop orders placed above key resistance levels.
- Typically found at previous highs, equal highs (EQH), and swing highs.
- Smart Money often targets these zones to trigger short squeezes before reversing.
Example of BSL in Trading
A chart showing price sweeping previous highs before a bearish reversal confirms buy-side liquidity absorption.
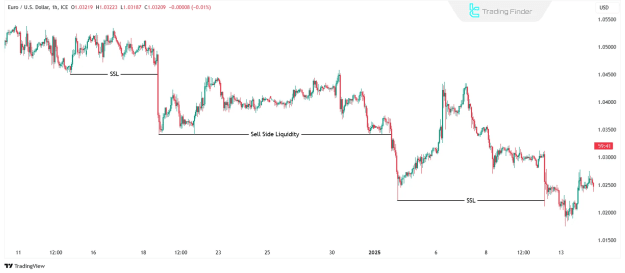
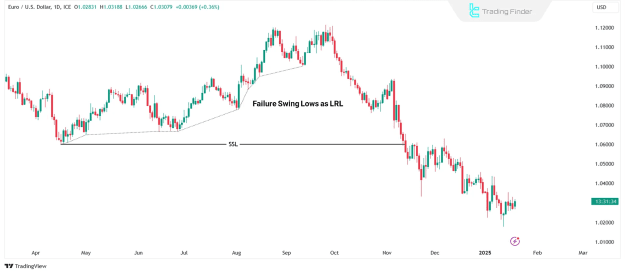
2. Sell-Side Liquidity (SSL)
- Comprises sell-stop orders clustered below support levels.
- Commonly located near previous lows, equal lows (EQL), and swing lows.
- Institutional traders exploit SSL to trap retail sellers before a bullish reversal.
Example of SSL in Trading
Price dipping below a key support level, triggering stop losses, then sharply reversing upward.
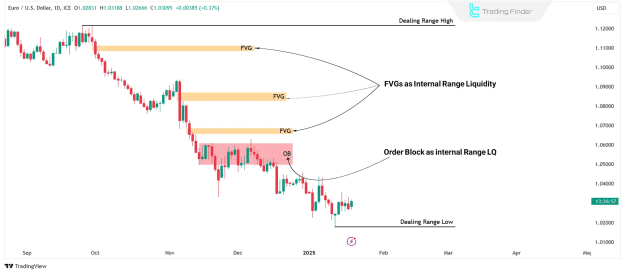
3. Internal Liquidity
- Formed by Fair Value Gaps (FVGs) and Order Blocks (OBs).
- Acts as temporary equilibrium zones before price moves toward external liquidity.
- Used for short-term pullbacks and continuation setups.
Example of Internal Liquidity
A Fair Value Gap (FVG) serving as a retracement zone before price resumes its trend.
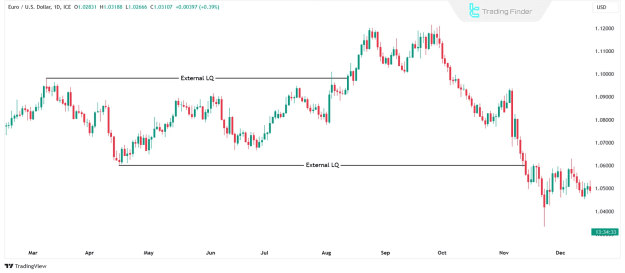
4. External Liquidity
- Represents major swing highs and lows where price tends to gravitate.
- Critical for identifying reversal points and breakout continuation zones.
Example of External Liquidity
EUR/USD approaching a monthly high before a significant reversal.
Key Liquidity Levels in Forex
The most important liquidity zones include:
- Previous Month’s High/Low (PMH/PML) – Major reversal or target zones.
- Previous Week’s High/Low (PWH/PWL) – Mid-term trend confirmation levels.
- Previous Day’s High/Low (PDH/PDL) – Short-term trading reference points.
- Session Highs/Lows (Asian, London, New York) – Intraday liquidity pools.
Draw on Liquidity (DOL): How Price Moves Toward Liquidity Zones
DOL describes the market’s tendency to seek and absorb liquidity before reversing.
Steps to Identify DOL
- Locate External Liquidity – Identify major highs/lows on higher timeframes (Daily/Weekly).
- Find Internal Liquidity – Detect FVGs and Order Blocks on lower timeframes (1H/15M).
- Observe Price Movement – Price typically shifts from internal to external liquidity.
- Confirm Market Structure Shifts (MSS) – Break of internal liquidity often leads to external liquidity sweeps.
- Fine-Tune Entries with Lower TFs – Use 5M/1M charts for precise execution.
High-Resistance vs. Low-Resistance Liquidity
Low-Resistance Liquidity (LRL)
- Occurs when price fails to absorb liquidity and reverses abruptly.
- Also known as Failure Swings (fake breakouts).
Example of LRL
- Price rejects a swing high in a downtrend without a full sweep.
- False breakout at a key support followed by a sharp reversal.
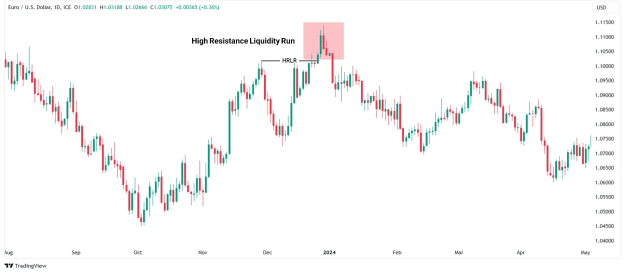
High-Resistance Liquidity (HRL)
- Happens when price fully absorbs liquidity before reversing.
- Often seen in stop hunts before trend reversals.
Example of HRL
- Price breaks a previous high, triggers buy stops, then reverses downward.
- A liquidity sweep below a low before a strong bullish move.
Conclusion
Understanding liquidity in Forex is crucial for institutional trading strategies like Smart Money and ICT. Key takeaways:
- Buy-side and sell-side liquidity indicate stop-loss clusters.
- Internal and external liquidity help predict price movements.
- Draw on Liquidity (DOL) explains how markets target key zones.
- High vs. low-resistance liquidity differentiates between fakeouts and valid reversals.