• Home
  • Forums
  • News
  • Calendar
  • Coins
  • Market
  • Login
  • Join
  • 4:52pm
Menu
  • Forums
  • News
  • Calendar
  • Coins
  • Market
  • Login
  • Join
  • 4:52pm
Sister Sites
  • Metals Mine
  • Energy EXCH
  • Forex Factory

Options

Bookmark Thread

First Page First Unread Last Page Last Post

Print Thread

Similar Threads

What is A book vs B book in Forex trading? 30 replies

A book forex brokers VS B book brokers, differences? 12 replies

Traders' Book Club 10 replies

The Book Club 5 replies

  • Trading Discussion
  • /
  • Reply to Thread
  • Subscribe
  • 1,459
Attachments: The Finance Book Club
Exit Attachments
Tags: The Finance Book Club
Cancel

The Finance Book Club

  • Last Post
  •  
  • 1 6667686970 Page 71
  • 1 686970 Page 71
  •  
  • Post #1,401
  • Quote
  • Aug 12, 2023 12:54am Aug 12, 2023 12:54am
  •  clemmo17
  • Joined Jul 2016 | Status: Member | 2,481 Posts
2.3.1.3 Volume Bars

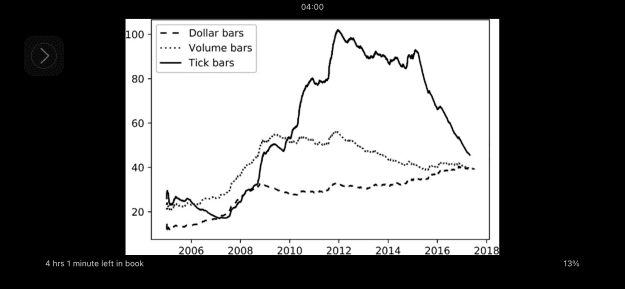
  1. One problem with tick bars is that order fragmentation introduces some arbitrariness in the number of ticks. For example, suppose that there is one order sitting on the offer, for a size of 10. If we buy 10 lots, our one order will be recorded as one tick. If instead on the offer there are 10 orders of size 1, our one buy will be recorded as 10 separate transactions.
  2. This is further exacerbated by ‘matching engines’ that split fills up into many artificial partial fills
  3. Volume bars circumvent that problem by sampling every time a pre-defined amount of the security's units (shares, futures contracts, etc.) have been exchanged. For example, we could sample prices every time a futures contract exchanges 1,000 units, regardless of the number of ticks involved.


2.3.1.4 Dollar Bars


  1. Dollar bars are formed by sampling an observation every time a pre-defined market value is exchanged. Of course, the reference to dollars is meant to apply to the currency in which the security is denominated,
  2. First, suppose that we wish to analyze a stock that has exhibited an appreciation of 100% over a certain period of time. Selling $1,000 worth of that stock at the end of the period requires trading half the number of shares it took to buy $1,000 worth of that stock at the beginning. In other words, the number of shares traded is a function of the actual value exchanged.
  3. If you compute tick bars and volume bars on E-mini S&P 500 futures for a given bar size, the number of bars per day will vary wildly over the years. That range and speed of variation will be reduced once you compute the number of dollar bars per day over the years, for a constant bar size. Figure 2.1 plots the exponentially weighted average number of bars per day when we apply a fixed bar size on tick, volume, and dollar sampling methods.

Attached Image (click to enlarge)
Click to Enlarge

Name: 85323953-1C32-4798-BFC6-EB6C26326805.png
Size: 135 KB


  1. the number of outstanding shares often changes multiple times over the course of a security's life, as a result of corporate actions. Even after adjusting for splits and reverse splits, there are other actions that will impact the amount of ticks and volumes, like issuing new shares or buying back existing shares (a very common practice since the Great Recession of 2008). Dollar bars tend to be robust in the face of those actions.

 
2
  • Post #1,402
  • Quote
  • Edited 5:45pm Aug 12, 2023 2:18pm | Edited 5:45pm
  •  clemmo17
  • Joined Jul 2016 | Status: Member | 2,481 Posts
2.3.2 Information-Driven Bars

  1. information-driven bars sample more frequently when new information arrives to the market. In this context, the word “information” is used in a market microstructural sense. As we will see in Chapter 19, market microstructure theories confer special importance to the persistence of imbalanced signed volumes, as that phenomenon is associated with the presence of informed traders. By synchronizing sampling with the arrival of informed traders, we may be able to make decisions before prices reach a new equilibrium level.


2.3.2.1 Tick Imbalance Bars

  1. The idea behind tick imbalance bars (TIBs) is to sample bars whenever tick imbalances exceed our expectations.
  2. The definition of a tick sequence and the tick rule is fairly convoluted and mathy
  3. We can understand TIBs as buckets of trades containing equal amounts of information (regardless of the volumes, prices, or ticks traded). The notion that trade groups contain information is not uncontroversial.


2.3.2.2 Volume/Dollar Imbalance Bars

  1. The idea behind volume imbalance bars (VIBs) and dollar imbalance bars (DIBs) is to extend the concept of tick imbalance bars (TIBs). We would like to sample bars when volume or dollar imbalances diverge from our expectations.


2.3.2.3 Tick Runs Bars

  1. TIBs, VIBs, and DIBs monitor order flow imbalance, as measured in terms of ticks, volumes, and dollar values exchanged. Large traders will sweep the order book, use iceberg orders, or slice a parent order into multiple children, all of which leave a trace of runs in the { b t } t = 1, …, T sequence. For this reason, it can be useful to monitor the sequence of buys in the overall volume, and take samples when that sequence diverges from our expectations.
  2. In this definition of runs we allow for sequence breaks. That is, instead of measuring the length of the longest sequence, we count the number of ticks of each side, without offsetting them (no imbalance). In the context of forming bars, this turns out to be a more useful definition than measuring sequence lengths. Why?


2.3.2.4 Volume/Dollar Runs Bars

  1. Volume runs bars (VRBs) and dollar runs bars (DRBs) extend the above definition of runs to volumes and dollars exchanged, respectively. The intuition is that we wish to sample bars whenever the volumes or dollars traded by one side exceed our expectation for a bar.


Yes there are more bars under heaven and earth than are dreamed of in your philosophy, Horatio. Every twist on traditional bars gives a slightly different view of the market’s past life. Does it really matter? Is one of these the objective timeline that will show us insights to the future?

In my youth a traditional bar was an Irish pub where you got drunk enough to gain the courage to dance with a girl. It seems maybe these bars are not that different. Once you find one that gives you a sufficiently distorted view of the past you boldly commit to an uncertain dance for the promise of a profitable tryst.

Attached Image (click to enlarge)
Click to Enlarge

Name: 72EB9A43-6520-48BD-9534-499E1D47B3B1.png
Size: 38 KB
 
1
  • Post #1,403
  • Quote
  • Aug 14, 2023 11:48am Aug 14, 2023 11:48am
  •  clemmo17
  • Joined Jul 2016 | Status: Member | 2,481 Posts
2.4 Dealing with Multi-Product Series

  1. Sometimes we are interested in modelling a time series of instruments, where the weights need to be dynamically adjusted over time.
  2. Events that alter the nature of the time series under study need to be treated properly, or we will inadvertently introduce a structural break that will mislead our research efforts. And what if those ‘events’ are the incoming trade flows themselves?
  3. In my experience, people struggle unnecessarily when manipulating futures, mainly because they do not know how to handle the roll well. The same can be said of strategies based on spreads of futures, or baskets of stocks or bonds.
  4. I call it the “ETF trick” because the goal is to transform any complex multi-product dataset into a single dataset that resembles a total-return ETF.

2.4.1 The ETF trick

  1. Suppose we wish to develop a strategy that trades a spread of futures. A few nuisances arise from dealing with a spread rather than an outright instrument.

    1. First, the spread is characterized by a vector of weights that changes over time. As a result, the spread itself may converge even if prices do not change. When that happens, a model trading that series will be misled to believe that PnL (the net mark-to-market value of profits and losses) has resulted from that weight-induced convergence.
    2. Second, spreads can acquire negative values, because they do not represent a price. This can often be problematic, as most models assume positive prices.
    3. Third, trading times will not align exactly for all constituents, so the spread is not always tradeable at the last levels published, or with zero latency risk. Also, execution costs must be considered, like crossing the bid-ask spread.

  2. One way to avoid these issues is to produce a time series that reflects the value of $1 invested in a spread. Changes in the series will reflect changes in PnL, the series will be strictly positive (at worst, infinitesimal), and the implementation shortfall will be taken into account. This will be the series used to model, generate signals, and trade, as if it were an ETF.

 
3
  • Post #1,404
  • Quote
  • Aug 14, 2023 11:48pm Aug 14, 2023 11:48pm
  •  clemmo17
  • Joined Jul 2016 | Status: Member | 2,481 Posts
2.5 Sampling Features

  1. So far we have learned how to produce a continuous, homogeneous, and structured dataset from a collection of unstructured financial data. Have we though? We’ve been given the broad strokes and left to ponder the execution for ourselves, or hire M at a premium fee. Although you could attempt to apply an ML algorithm on such a dataset, in general that would not be a good idea, for a couple of reasons.

    1. First, several ML algorithms do not scale well with sample size (e.g., SVMs). This seems like a poor reason. For one thing M said he was agnostic to the ML algo.
    2. Second, ML algorithms achieve highest accuracy when they attempt to learn from relevant examples. Is M saying that the raw data of past history is irrelevant?

  2. If we ask a classifier to predict the sign of the next 5% absolute return after certain catalytic conditions, we are more likely to find informative features that will help us achieve a more accurate prediction. I don’t like this at all. It reminds me of a news filter on an EA. M does not plainly state what he means by a catalyst.

2.5.1 Sampling for Reduction

  1. As we have mentioned earlier, one reason for sampling features from a structured dataset is to reduce the amount of data used to fit the ML algorithm. This operation is also referred to as downsampling . This is often done by either sequential sampling at a constant step size (linspace sampling), or by sampling randomly using a uniform distribution (uniform sampling). Renko blocks or Heiken Aishi candles??


2.5.2 Event-Based Sampling

  1. Portfolio managers typically place a bet after some event takes place, such as a structural break (Chapter 17), an extracted signal (Chapter 18), or microstructural phenomena (Chapter 19). These events could be associated with the release of some macroeconomic statistics, a spike in volatility, a significant departure in a spread away from its equilibrium level, etc. We can characterize an event as significant, and let the ML algorithm learn whether there is an accurate prediction function under those circumstances. Unless the ML algo learns to identify these events on its own does this still count as a ML solution or is it simply statistical?


2.5.2.1 The CUSUM Filter

  1. The CUSUM filter is a quality-control method, designed to detect a shift in the mean value of a measured quantity away from a target value.
  2. Lam and Yam [1997] propose an investment strategy whereby alternating buy-sell signals are generated when an absolute return h is observed relative to a prior high or low. Those authors demonstrate that such strategy is equivalent to the so-called “filter trading strategy” is that good?
  3. One practical aspect that makes CUSUM filters appealing is that multiple events are not triggered by gRaw (the raw data sequence) hovering around a threshold level, which is a flaw suffered by popular market signals such as Bollinger bands. Like step-filtering using an inverse fisher transform? No sir, I don’t like any of this. It’s a ‘more things change, the more they stay the same’ feeling for me.

 
1
  • Post #1,405
  • Quote
  • Aug 16, 2023 8:55am Aug 16, 2023 8:55am
  •  loseyouself
  • | Joined Aug 2023 | Status: Junior Member | 1 Post
thanks for sharing
 
1
  • Post #1,406
  • Quote
  • Aug 16, 2023 1:38pm Aug 16, 2023 1:38pm
  •  driven18
  • Joined Jul 2012 | Status: Member | 940 Posts | Online Now
clemmo17, I send you a PM 2 days ago regarding "Clemmo's Systemo's (fundraiser)". I enjoy trading algos and trying to help.
 
1
  • Post #1,407
  • Quote
  • Aug 30, 2023 4:45pm Aug 30, 2023 4:45pm
  •  Kefada
  • Joined Jul 2021 | Status: Coder for Hire | 156 Posts
Quoting clemmo17
Disliked
First, the spread is characterized by a vector of weights that changes over time. As a result, the spread itself may converge even if prices do not change. When that happens, a model trading that series will be misled to believe that PnL (the net mark-to-market value of profits and losses) has resulted from that weight-induced convergence.
Ignored
Is there any way to tell if a price change is by spread convergence/ 'weight change' and not tick price change?
 
 
  • Post #1,408
  • Quote
  • Sep 12, 2023 4:02am Sep 12, 2023 4:02am
  •  clemmo17
  • Joined Jul 2016 | Status: Member | 2,481 Posts
Quoting Kefada
Disliked
{quote} Is there any way to tell if a price change is by spread convergence/ 'weight change' and not tick price change?
Ignored
That’s an excellent question and just one reason why you should be spearheading this review rather than me!

My best guess is yes, but only if the data is recorded and logged, and most importantly, shared by the broker.
 
 
  • Post #1,409
  • Quote
  • Last Post: Sep 12, 2023 4:18am Sep 12, 2023 4:18am
  •  clemmo17
  • Joined Jul 2016 | Status: Member | 2,481 Posts
I must admit I’ve lost some passion for this project but I haven’t stopped reading. I’m listening to “Red Notice” by Bill Browder.

We’re close to the same age and we attended the same fraternity. It’s a glimpse of a totally different life I might have led if I had made different choices, had slightly different outlooks.

The book does not focus on money and finance as much as it discusses politics, and daily life, but Browder remembers everything and it reinforces my view that we are not nearly as ‘in control’ of our destinies as we expect we are.

Browder goes through hell and back just to try and make a few hundred million (but maybe more if he evaded taxes as he was charged) in post-Soviet Russia. And although our physical safety is not as precarious as his, most traders can probably relate to the stress.

Also, in case you’re wondering if Russian oligarchs are as mad as they are portrayed in the media, at least according to Browder, yes. Yes they are.
 
5
  • Trading Discussion
  • /
  • The Finance Book Club
  • Reply to Thread
    • 1 6667686970 Page 71
    • 1 686970 Page 71
0 traders viewing now
Top of Page
  • Facebook
  • Twitter
About CC
  • Mission
  • Products
  • User Guide
  • Blog
  • Contact
CC Products
  • Forums
  • Calendar
  • News
  • Coins
  • Market
CC Website
  • Homepage
  • Search
  • Members
  • Report a Bug
Follow CC
  • Facebook
  • Twitter

CC Sister Sites:

  • Metals Mine
  • Energy EXCH
  • Forex Factory

Crypto Craft® is a brand of Fair Economy, Inc.

Terms of Service / ©2023