Hey Guys,
I've started investing into Crypto through the popular method of dollar cost averaging. I was putting $x a week into the crypto currencies I like, but I wanted something that could time the market better.
I recently released my OGT Bollinger Bands Trend Indicator on TradingView (tutorial video thread here) and it works great for cost averaging crypto/stocks which you are long term bullish.
In the video below I share how you can find great dollar cost averaging entry points as well as my Binance account of the crypto's I am holding.
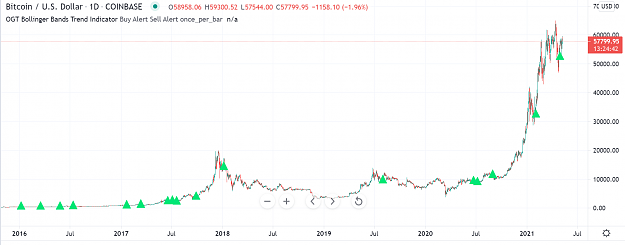
Here is an example chart for BTC/USD Daily chart which provided 17 buy signals sine 2016. You can get more signals the lower the TF you choose.
Just search OGT Bollinger Bands Trend Indicator on TradingView to add it to your chart.
I've started investing into Crypto through the popular method of dollar cost averaging. I was putting $x a week into the crypto currencies I like, but I wanted something that could time the market better.
I recently released my OGT Bollinger Bands Trend Indicator on TradingView (tutorial video thread here) and it works great for cost averaging crypto/stocks which you are long term bullish.
In the video below I share how you can find great dollar cost averaging entry points as well as my Binance account of the crypto's I am holding.
Inserted Video
Here is an example chart for BTC/USD Daily chart which provided 17 buy signals sine 2016. You can get more signals the lower the TF you choose.
Just search OGT Bollinger Bands Trend Indicator on TradingView to add it to your chart.
Attached Image (click to enlarge)
Never stop investing. Never stop improving. Never stop doing something new