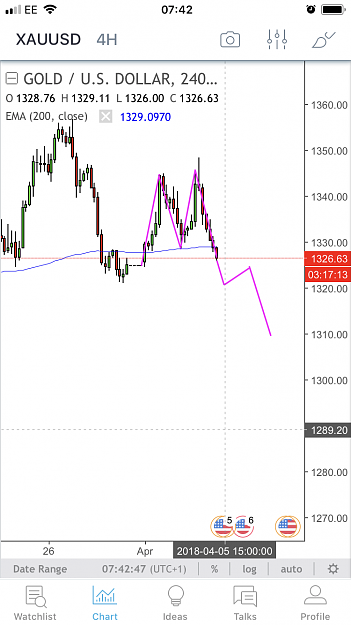
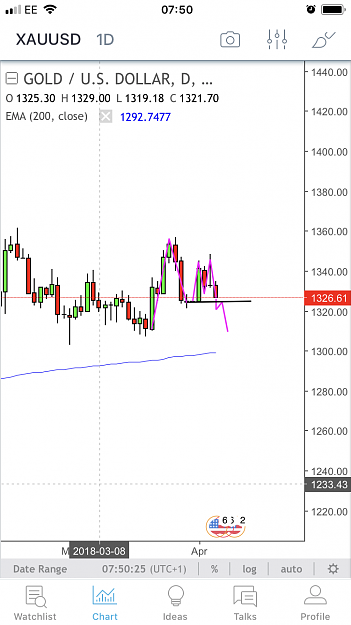
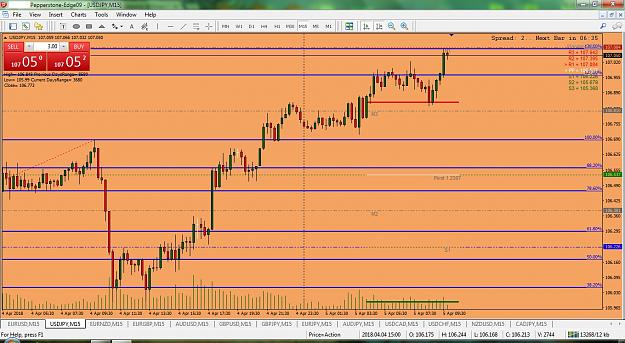
Some people have been liking my post and I get a few inbox questions with regards to chart patterns, I trade naked based alone on chart patterns I use 39 chart patterns. These don’t always play out as you guys know but it’s just how I trade. I trade the Daily and 4 hours and sometimes I use the 15 minute. Anyway I’ll post up on here what I’m looking at plus it helps me identify where I went wrong and what worked for me.
All I ask is if you put a chart up please draw it up on a naked chart so it’s easy for people to see and not rammed with every indicator under the sun causin actual chart to be all squashed up.
Finally I don’t trade harmonic patterns they do work but i just don’t trade them
UPDATE
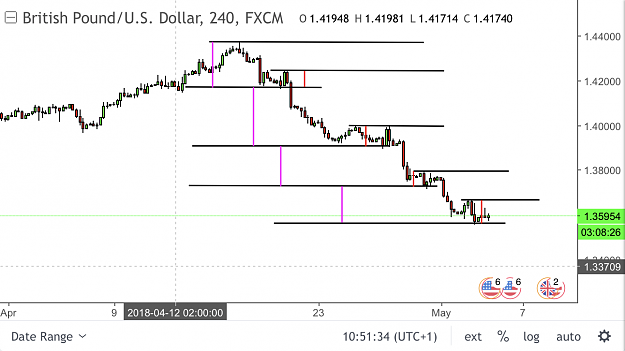
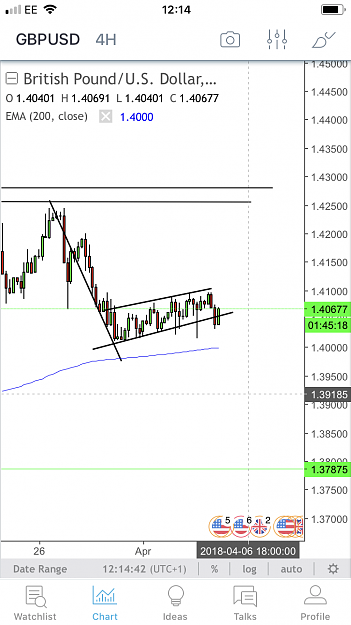
How to view if a trend is getting stronger or weaker.
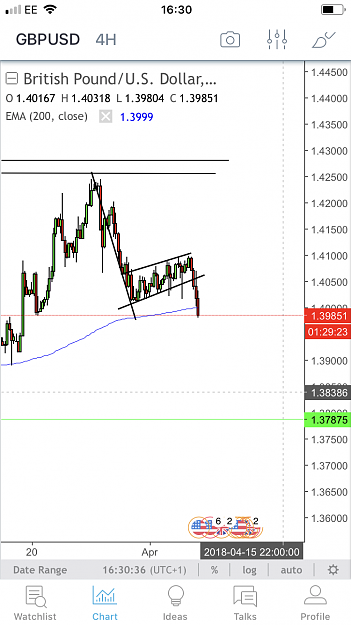
I use Projection and Depth take a look at the chart below on GU I see the bear trend getting weaker.
Why ?
Rule is as follows-A INCREASE in Projection is a sign of a healthy trend (STRONG)
A DECREASE in projection is a sign of a unhealthy trend (WEAK)
A DECREASE in depth is a sign of a healthy trend (STRONG)
A INCREASE in depth is a sign of a unhealthy trend (WEAK)
The chart below shows projection (purple) and depth (Red)
note how we are seeing a decrease in projection (or staying same no increase) and the depth (red) is now starting to increase this bear trend is not healthy.
https://youtu.be/r8gDiNsoN_c
All I ask is if you put a chart up please draw it up on a naked chart so it’s easy for people to see and not rammed with every indicator under the sun causin actual chart to be all squashed up.
Finally I don’t trade harmonic patterns they do work but i just don’t trade them
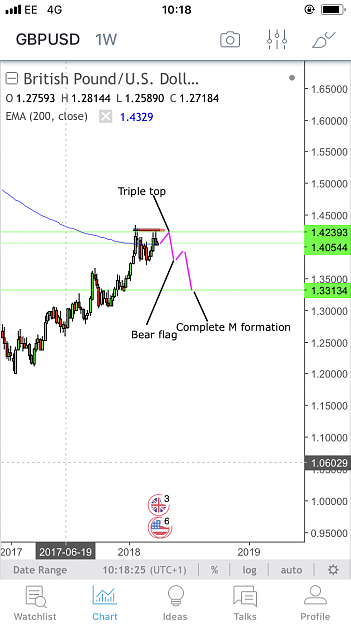
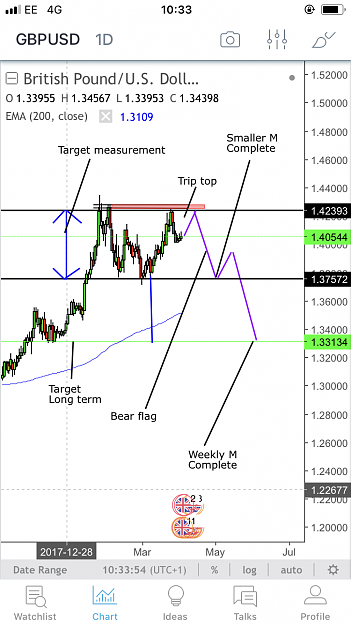
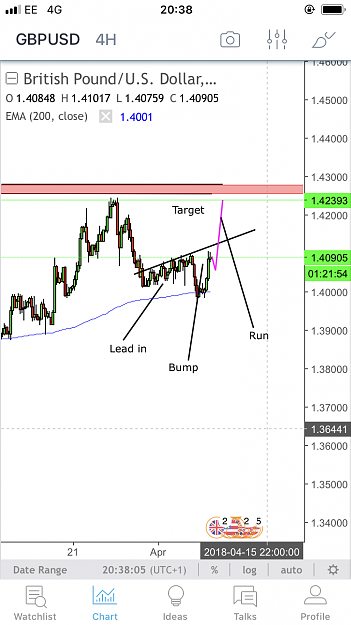
UPDATE
How to view if a trend is getting stronger or weaker.
I use Projection and Depth take a look at the chart below on GU I see the bear trend getting weaker.
Why ?
Rule is as follows-A INCREASE in Projection is a sign of a healthy trend (STRONG)
A DECREASE in projection is a sign of a unhealthy trend (WEAK)
A DECREASE in depth is a sign of a healthy trend (STRONG)
A INCREASE in depth is a sign of a unhealthy trend (WEAK)
The chart below shows projection (purple) and depth (Red)
note how we are seeing a decrease in projection (or staying same no increase) and the depth (red) is now starting to increase this bear trend is not healthy.
https://youtu.be/r8gDiNsoN_c
Attached Image (click to enlarge)
Attached Image