prices starts moving from convergence of moving averages points, so identify points of convergence of moving averages to take position from there, till convergence of moving averages is not there it is sitting on the sideline only !!
and moving averages are the ones that works always !!! it is higher top and higher bottom and lower top and lower bottom and then to find out when prices moves is the point of convergence of moving averages.
------------------------------------------------------------------------------------------------------------------------------------------------------------------
load 50 ema of all timeframes ( monthly, weekly, daily, H4(h6 is more synchronised with D1), H1, M15, M5, M1) in single chart using mtf function of mtf moving average indicator,
and this way you can see 50 emas in single chart of important timeframes, 50 ema is support and resistance, and prices moves from 50 ema of one timeframe to 50 ema of other timeframe
==========================================================================================================================================================================================
this is for instruments whose chart is available for 24 hours round the clock
-----------------------------------------------------------------------------------------------------------------------------------------------------------------------------------------------------------------
for instruments chart where it is traded during only exchange open time (roughly 6-7 hours), in this case, in above timeframes H4 needs to be replaced by H1 , (so the sequence in this case of timeframe is monthly, weekly, daily, H1, M15, M5, M1 rest remains same in sync.)
====================================================================================================================================================================================
alternatively you can also load 13 ema of above same time frames in single chart and that will yield the same result as ( 13 ema x 4 =52 (50 ema)), as above timeframes are also equally divided by factor of 4 as described below
sniper rishijay trading system forex updated version of sniper rishijay trading system.
moving average mt4 and mt5 based trading system
moving average convergence and divergence in all timeframes swings
what is new ---
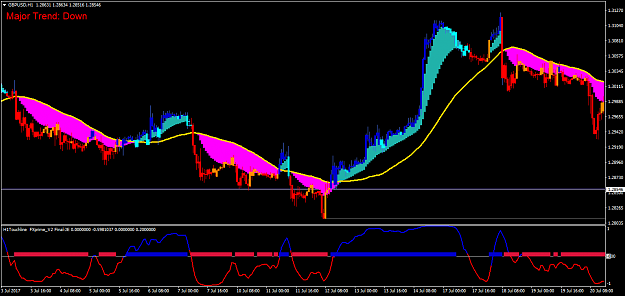
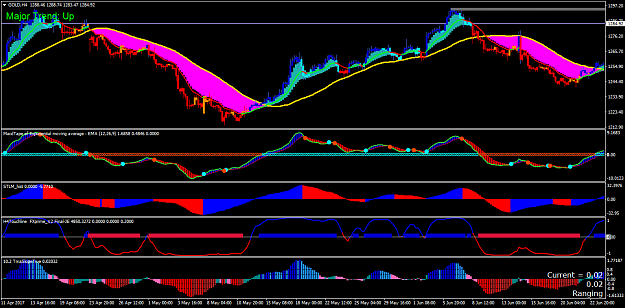
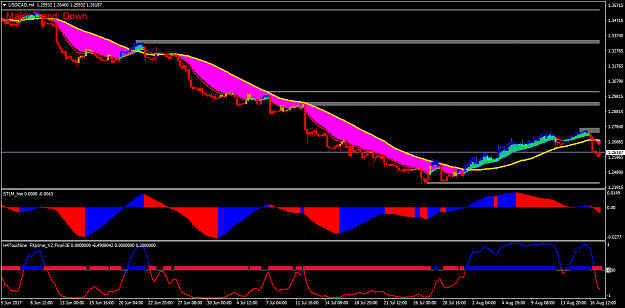
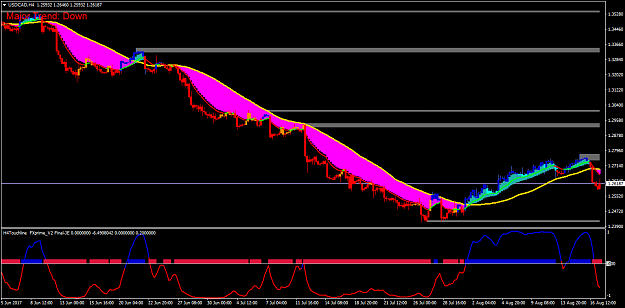
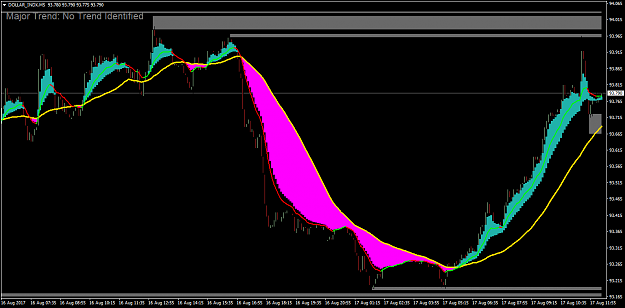
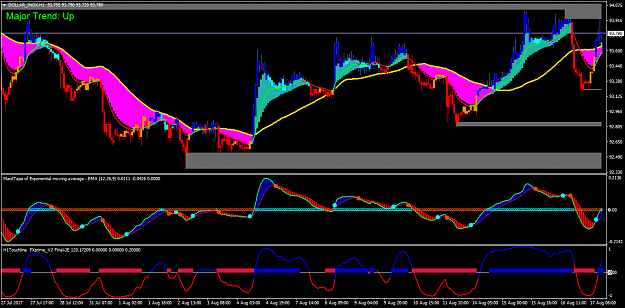
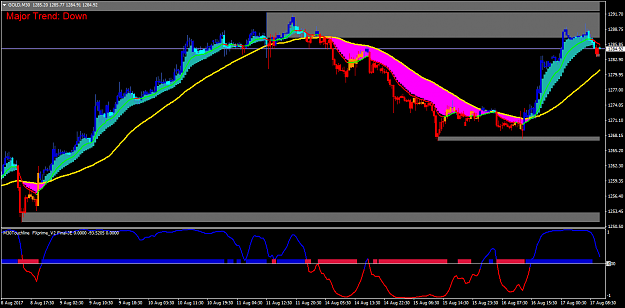
-golden line-- created golden line that helps to decide make or break level for ongoing trend.
- macd cloud trading with absolutely new macd indicator . that enables simply cloud based trading with ease.
-more visual trend identification immediately by looking at cloud color and golden line possible.
-trading rules made more simplified-
buy signal.-- 1)-- macd cloud above golden line.
2)-- bar color--blue that matches with cloud color and indicators color in separate lower indicator panel.
3)-- buy arrow appears on chart
sell signal-- 1)-- macd cloud below golden line.
2)-- bar color--red color that matches with cloud color and indicators color in separate lower indicator panel.
3)-- sell arrow appears on chart
-------------------------------------------------------------------------------
have profitable, precise and simplified accurate non repainting forex trading with sniper rishijay trading system. fx
rishijay trading system of moving averages
======================================
THANKS TO MLADEN, MRTOOLS AND XARD
and rijay @ rijay's system of moving averages
forex-station.com/viewtopic.php?f=578267&t=8473287
====================================================
create Downloads folder in indicator folder of mt4 terminal and put all indicators in this Downloads folder , and restart mt4(mt5) terminal
otherwise this templets will not work !!
mindset and risk management is the key. risk only 1-2% of your capital on each trade. risk management is how you control your lot size while trading !!
call and put options open interest levels are the real support and resistance levels, from where prices jumps and reacts.
market moves from convergence of moving averages to divergence of moving averages alternatively
moving averages to use-- 5,13(20, 13-20 ema zone decides swings), 50,200 exponential moving averages.
prices moves from point when there is convergence of moving averages
when there is convergence of moving averages, from this convergence points prices moves fast(13 ema converging on 50 ema for next swing to start)
more the convergence of moving averages of all timeframes more stronger the next move and trend will be.!!
50 ema in any timeframe is equillibrium point from where new swing begins, 50 ema acts as point of mean reversal.
so prices moves from 50 ema of one timeframe to other( see below timeframes synchronised for that) qwma is set as 50 ema of this timeframes,
5 ema, 13(13-20 ema zone), 50 ema , 200 ema does the same representation, reflecting 50 ema of corresponding higher and lower timeframes
above 50 ema(exponential moving average) and below 50 ema(exponential moving average) = above center line of macd and below center line of macd(centerline of macd=50 ema)
13 ema x 4 = 52 ( 50 ema)
so loading 13 ema of(higher timeframes) all timeframes in single chart will show 50 ema(lower timeframes) of all timeframes in single chart also
for example 13 ema H4= 50 ema H1 ( higher timeframe 13 ema = lower time frames 50 ema, (for synchronised timeframes M1,M5,M15,H1,H4)
so you are looking at 13 ema of all timeframes in this templet = you are looking at 50 ema of all timeframes
and prices bounces from 50 ema of one timeframe to 50 ema of other timeframes
50 ema is from where next move starts
================================================================================================
when all timeframes moving averages align in one direction then you have a move which is tradable. when all higher timeframes are aligned you can draw trendline and move will be available to trade at the break of the trendline in the direction of trend( in the direction of aligned higher timeframes moving averages)
you need to pay attention to price action more then on any indicators as indicators will be late to react and market is fast to move, if you want to enter on when there is signal on indicator then you will enter late and already most of the move on the swing is done with.
so basically you can trade with moving averages, trendline and price action.(higher top higher bottom and lower top lower bottom)
and then mark (with real time data of call and put )highest open interest levels of call and put options on chart as lines (this are support and resistance levels) and then use real time data of orders traded on exchange to see when this support and resistance levels are violated by large orders, once there is convergence points of moving averages appears and trendline is violated.
after convergence of moving averages is done, trendline violation is a point of entry in the direction of the higher timeframe trend.
daily, weekly, monthly, quarterly and yearly close prices are strong support and resistance levels
TIME ZONE DIVISION--
===============
-best timeframes for analysis-
-1)for instruments traded for 24 hours(factor of 4)-will be 15 minutes, 1 hour( 15 minutes X 4=60 minutes), 4 hour( 1 hour X 4= 4 hour).... like that, so 30 minutes is odd time frame to analyse , ( this will set time zone division for instruments for instruments traded for 24 hours like forex)
-2) for instruments that are traded on only during exchange open hours( usually 6 hours approximately on all exchanges, 6hours X 4= 24 hours)
(here also factor of 4) -here in this case 15 minutes time frame will equate to 1 hour time frame(60 minutes)(15 minutes x4) for instruments traded for 24 hours, and 1 hour time frame will equate to 4 hour time frame(1 hour x 4) for instruments traded for 24 hours duration, ..... so on
-----------------------------------------------------------------------------------------------------------------------------------------------------------------------------------------------------
PRICE ZONE DIVISION-
================
Apply factor of 4 on moving average to get better entry points,
basics of division- for crucial 13 , 50 ,200 ema(factor of 4 as with time zones to get synchronization with time zones)-13 ema x4=52 (50 ema), 50 emaX4= 200 ema
so on above formula,
1)for instruments traded for 24 hours- 50 ema on 1 hourly chart=13 ema on 4 hourly chart( factor of 4 for both price zones and time zones)
- 200 ema to 1 hourly chart= 50 ema on 4 hourly chart( again,factor of 4 for both price zones and timezones)
....so 0n for other time frames also
-2) for instruments that are traded on only during exchange open hours( usually 6 hours approximately on all exchanges, 6hours X 4= 24 hours)
- 50 ema on 15 minutes chart=13 ema on 1 hourly chart(60 minutes)( factor of 4 for both price zones and time zones)
-200 ema on 15 minutes chart = 50 ema on 1 hourly chart( again,factor of 4 for both price zones and timezones)
so on for other time frames also,
so this is how system is based , it revolves around on equal time and price division, magic factor here is -4
you will find now 5 minutes,15 minutes, 1 hourly and 4 hourly charts in sync with this system indicators, (30 minutes time frame will not be in sysn with the system as it does not fall into equal division of time and price zones)
----------------------------------------------------------------------------------------------------------------------------------------------------------------------------
convergence of moving averages 13 ema and 50 ema provides best entry points.
best entry points and to avoid sideways markets -- all time frame averages to converge(all higher time frame trend to align) as much as possible and then to see moving averages to converge on time frames as explained above, to minimise risk and improve reward probability.
where are low risk entry points and anticipating next fast price action
- at convergence of moving averages 13 and 50 ema( at this points there is maximum convergence of all lower timeframes with maximum compression of prices of all lower time frames, so one can anticipate price expansion ahead)
-----------------------
MOVING AVERAGES AND TIME ZONE DIVISION
( equal division of price zones and time zones by factor - 4)( to match for all crucial H4 candle closing timing, as major exchange like US, london and tokyo's session opeing and closing time falls on closing hours of H4 candles where most of moves comes)( last few moments on any candle is very important for decisive move to take place)(opening and closing time of exchanges is where volume is generated, opening price is set up by amatuer traders and closing prices on exchange is set up by professional trades)( closing prices of session is the price which is the closest to the interbank close price)
______________________________________________
___________________________________________________
50 ema Daily =13 ema Weelky = 5 ema monthly
200 ema Daily = 50 ema weekly = 13 ema monthly = 5 ema quarterly
200 ema weekly = 50 ema monthly = 13 ema quarterly =5 ema yearly
200 ema monthly= 50 ema quarterly= 13 ema yearly
-------------------------------------------------------------------------------
for instruments traded 24 hours like forex( for charts available all 24 hours)
13 ema D1 = 50 ema H4(exact is 50 ema H6) = 200 ema H1
13 ema H4 = 50 ema H1 = 200 ema M15
13 ema H1 =50 ema M15 = 200 ema M5
13 ema M15 = 50 ema M5 = 200 ema M1
-------------------------------------------------------------------
for instruments traded during exchange open time( for charts available only during exchange open time)
13 ema D1 = 50 ema H1 =200 ema M15
13 ema H1 =50 ema M15 = 200 ema M5
13 ema M15 = 50 ema M5 = 200 ema M1
______---------------------------------------
so H4 of 24 hours traded instruments = H1 of instrument traded only on exchange hours
so H1 of 24 hours traded instruments = M15 of instrument traded only on exchange hours
--------------------------------------------------------------------------
so match H4 chart of forex (24 hours chart) to H1 chart of same forex pair with chart available during exchange open time, for better execution when both charts align you have a move available to trade
-----------------------------------------------------------------------------------------
________________________________________________________________________________________________________________________________________________________________________________________________________________________
note- M30 is the oddest time frame to trade, avoid trading on this time frame.
-----------------------------------------------------------------------------------------------
zone between 13 ema and 20 ema is all important for short term swing to end, if prices dips below this zone and does not come back above it fast in next few candles , brace for reversal to come and break of this 13 ema and 20 ema zone will flip atr of prices to other side.( usually with large and fast price action bar that will less likely to reverse as it breaks multiple timeframe averages, in one bar, and catches all traders to wrong side and sets panic in traders to make them square off their positions )
------------------------------------------------------------------------------
in all time frames 50 ema is the equilibrium point, from where next price action begins and price strength comes
50 ema = 50 level on rsi (14) = centerline of macd= centerline of stlm histogram
--------------------------------------------------------------------------------------------------------------
as 13 ema and 20 ema zone is all important, as start and end of swing, it is all about convergence and divergence of this zones in multiple timeframes(qwma set as this 13-20 ema zones, loaded all timeframes qwma in single chart = all timeframes swings in single chart)
price action is of paramount importance for break of trendline(on closing basis) and for initiation of trade., around 70 % of times prices will pull back towards trendline to give better entry points after prices breaks trendline on closing basis of candle( this candle should be a large one and fast one)( to catch traders on wrong side suddenly and offguard, so that panic sets in the traders (counter trend traders and sideways market traders)and they rush in to square off their positions. at convergence of moving averages before prices starts its next move, it forms double top or double bottom commonly (and this tops are where stop loss should be) and then runs to break trendline.
rough estimate of targets-- length of consolidation ( draw horizontal line of length of consolidation and put the same line on vertically, ) that is your minimum targets.
prices tend to pull back towards the previous days close prices often before resuming its move for the day, as previous days close price is the most important for major banks,( interbank close), so is very important is the close at US market closing prices,
and exchange close price for stocks and indexes
for any country's currency, two close price are important
one is where is the close price on that country's interbank platform close. and other is where is close price of that country's currency on US session close(as that is decisive for daily candle close)
depending on how is closing on us session , the next day prices will open on that country's interbank platform and then will pull back to the previous day's close price on that country's interbank platform, and then again restart the move for the day in the direction of the trend.
this is also true for any other instrument like stocks and indexes
only in <10% of the time when there is very strong trend that this pull back to country's interbank close price level will be shallow.
price and volume move will come at
london open
tokyo close
us open
london close
us open
reliable volume is generate when there is interbank or market closing and opening hours overlap on major country sessions, that synchronizes with H4 candle close, and that is when good price action is anticipated.
like, tokyo close and london open overlap
london close and us open overlap
us close.
now H4 trend changes when lower timeframes starts aligning, like slowly 15 minutes, 16 minutes, 17 minutes, 18 minutes..............H1,H2, H3 timeframes slowly starts aligning in one direction (this is what histogram shows)
when all lower timeframes aligned, there appears big and fast price bar on chart and throws atr of prices(and so moving averages ) of all lower timeframes to other side as all timeframe crucial moving averages are breached in single bar, this large price bar sets panic among traders as they are now caught off guard and rush to close positions, this propels the reversal on chart in form of fast and large price action bar, mostly running fast to breach trendline
this reversal also gets reflected on macd histogram as cross of histogram above or below zero line(or cross of macd line and macd signal line)
so now the option to find out when trend is going to change and anticipate trend change coming is -one assess all lower timeframes below H4 turning on multiple timeframes chart like H3,H2,H1 ..... or to see on single chart with macd histogram of H4 timeframe, .( now with jurik smooth ribbon showing all timeframe trend in single chart of all timeframes i need not open all chart below H4 to see when they are aligning using qwma on single chart.
so one option is to synchronize all time frames in one single chart to see what is going on in diffenet timeframes and read it on one chart( like with qwma in above templets)
or the other option is to analyze all timeframes chart one by one to see what is status of trend on different timeframes.
so when macd line and macd signal line touches each other, that shows that all lower timeframes have reached alignment and big price bar is coming soon, direction of which is set by higher timeframe trend.
now if this all timeframe trends have aligned at points of convergence points of moving averages in multiple timeframes, then divergence with large price action bar is coming( good entry points at convergence points)
do not take trades when there is divergence of moving average already done, as this will again mean align to equilibrium point 50 ema in counter trend way retracement, again wait for convergence points on moving averages to appear.
now as both macd and stlm histogram are slow to react to price action as any other indicator and market is fast, so for entry i use price action( as above all timeframens aligns at convergence points , anticipate big price action in direction of trend, but this is just anticipation, and draw a trendline from one macd line cross point to other cross point, means lower timeframes strength points to lower timeframes weakening point,, once prices starts running fast with big price bar running to break trendline, that means all counter trend traders and sideways market traders are now stuck, be ready to open up position at break of trendline, prices usually stops at trendline after candle closes, and gives good entry point there, trendline break confirms reversal
timeframes that can be coupled are H4-H1, H1-M15, M15-M5, M5-M1, which ever timeframe you are trading, M30 does not fit with macd and moving averages atr of prices(13-20 ema zone on each timeframe)
-----------------------------------------------------------------------------------------------------------------
more the timeframes aligned more stronger move is expected.
more the higher timeframes aligned, more longer trend will emerge.
--------------------------------------------------------------------------
find out convergence points on instruments that is trending and then take trade as explained above.
loading moving average as posted previously or loading qwma adaptive fls(previously posted templet and indicators here on this thread) shows convergence points in all timeframes in single chart
stlm histogram and macd are for momentum change showing and multiple timeframe alignment only,
entry to trade is with price action , as price candle displays much information, and only take positions in trending market and only in direction of trend, so that even entry is bit wrong trend will take care of it.
spikes that comes above or below this convergence points (before start of move), on moving averages will not be tested if i have taken right trade and position will be in profit immediately
.
if macd lines have fallen too far away from its centerline, price most likely will not cross back 50 ema immediately, it will first come back and mean reverse to 50 ema and consolidates there and then will try to attempt to cross it.
market moves for convergence to divergence and macd shows the same , market is that regular in its behaviour from alternate convergence and divergence. higher time frames decides in which direction next convergence and divergence will come
moving averages
5, 13(13-20 ema zones), 50 and 200 ema (as it is more synchronized with time frames H4, H1, M15, M5 and M1)
---------------------------------------------------------------------------------------------------------------------------------------------
200 ema to find long term trend, 50 ema to find medium trend, 13-20 ema to find swings, and 5 ema( or macd line ) to catch price action(or just use purely price action reading)
for example of H4-H1 trading
for catching H4 swings, 13 ema H4 (13-20 zones) will catch it.
now H4 13 ema = 50 ema on H1 chart, so till prices are above 50 ema of H1 chart you are in upswing on H4 chart , any move towards 50 ema on H1 chart is buying opportunity.
----------------------------------------------------------------------------
reverse for down swing
macd lines-
macd line = 5 ema
macd signal line =13 ema
macd center line=50 ema
- so H1 upswing starts with up cross of macd line and macd signal line on H4(i.e upcross of 5 ema and 13 ema cross of H4= 13 ema and 50 ema upcross on H1) ,and ends with down cross of macd line and macd signal line cross of H4 (i.e downcross of 5 ema and 13 ema cross of H4= 13 ema and 50 ema down cross on H1)
in between pullbacks of prices on 50 ema H1(= 13 ema H4= 100 ema M30= 200 ema M15) are buying opportunities
price strength will emerge when macd line crosses its centerline
it is when higher timeframes moving averages align( for upswing in this sequence yearly, quarterly, monthly, weekly, daily, H4, H1 when all moving averages align in up direction you will have a move in lower timeframes) , that is when lower timeframes moves.
qwma set to show all timeframes swing zones and find out convergence of moving averages points in multiple timeframes
qwma set to match 13-20 ema zones.
with above posted indicators added.
if you want to see all timeframes swings in single chart
----------------------------------------------------------------------------------
this zones 13-20 ema zones are the ones from which prices react
and this zones are potential target areas.
convergence points are entry points in direction of higher timeframe zones.
ultimately its the context of moving averages in all timeframes , each moving average represents a timeframe
macd just represents convergence and divergence of moving averages only
13 * 4=52 ema( 50 ema)
15 minutes * 4 = 60 minutes
so multiplication or division by factor 4 is equal division of moving averages and timeframes
algo or program trading does not change the overall market structure , it is just a faster execution of orders but then at which point in history was mr. market slow !! algo are run in direction of the trend.
---------------------------------------------------------------------------------
qwma indicator setting
ma period = 25
ma speed = 2.5
average price =close
average speed should be adaptive = true
level type= quantile level
floating levels period =5
color change on = change color on outer levels cross
---------------------------------------------------------------------------------------
t3moving average ribbon indicator settings(as macd on chart)(mtf mode )-
t3period 1 = 5
t3hot 1= 0.2
t3 price 1= close price
t3original 1= true
t3period 2 = 11
t3hot 1= 0.63
t3 price 1= close price
t3original 1= true
--------------------------------------------------------------------------------------------------------------
========================================================================
ma_-_ribbon_2_2 indicator color ribbon settings.(MT5)
1)
fast time frame = 1 day
fast ma period = 13
fast ma methoe = exponential moving average
fast ma price = close
slow time frame = 1 day
slow ma period = 50
slow ma methoe = exponential moving average
slow ma price = close
colors ma ribbon= navy and firebrick
---
overlap second copy of indicator with following settings
2)
fast time frame = 4hours
fast ma period = 13
fast ma methoe = exponential moving average
fast ma price = close
slow time frame = 1 day
slow ma period = 13
slow ma methoe = exponential moving average
slow ma price = close
colors ma ribbon= navy and firebrick
---
overlap third copy of indicator with following settings
3)
fast time frame = 4hours
fast ma period = 1
fast ma methoe = exponential moving average
fast ma price = close
slow time frame = 4 hours
slow ma period = 13
slow ma methoe = exponential moving average
slow ma price = close
colors ma ribbon= 83,83,255 and 255,106,106
===============================================================================
--------------------------------------------------------------------------------------------
MTF_MCP_Price_MA_Difference indicator settings
50 period exponential moving average
and moving averages are the ones that works always !!! it is higher top and higher bottom and lower top and lower bottom and then to find out when prices moves is the point of convergence of moving averages.
------------------------------------------------------------------------------------------------------------------------------------------------------------------
load 50 ema of all timeframes ( monthly, weekly, daily, H4(h6 is more synchronised with D1), H1, M15, M5, M1) in single chart using mtf function of mtf moving average indicator,
and this way you can see 50 emas in single chart of important timeframes, 50 ema is support and resistance, and prices moves from 50 ema of one timeframe to 50 ema of other timeframe
==========================================================================================================================================================================================
this is for instruments whose chart is available for 24 hours round the clock
-----------------------------------------------------------------------------------------------------------------------------------------------------------------------------------------------------------------
for instruments chart where it is traded during only exchange open time (roughly 6-7 hours), in this case, in above timeframes H4 needs to be replaced by H1 , (so the sequence in this case of timeframe is monthly, weekly, daily, H1, M15, M5, M1 rest remains same in sync.)
====================================================================================================================================================================================
alternatively you can also load 13 ema of above same time frames in single chart and that will yield the same result as ( 13 ema x 4 =52 (50 ema)), as above timeframes are also equally divided by factor of 4 as described below
sniper rishijay trading system forex updated version of sniper rishijay trading system.
moving average mt4 and mt5 based trading system
moving average convergence and divergence in all timeframes swings
what is new ---
-golden line-- created golden line that helps to decide make or break level for ongoing trend.
- macd cloud trading with absolutely new macd indicator . that enables simply cloud based trading with ease.
-more visual trend identification immediately by looking at cloud color and golden line possible.
-trading rules made more simplified-
buy signal.-- 1)-- macd cloud above golden line.
2)-- bar color--blue that matches with cloud color and indicators color in separate lower indicator panel.
3)-- buy arrow appears on chart
sell signal-- 1)-- macd cloud below golden line.
2)-- bar color--red color that matches with cloud color and indicators color in separate lower indicator panel.
3)-- sell arrow appears on chart
-------------------------------------------------------------------------------
have profitable, precise and simplified accurate non repainting forex trading with sniper rishijay trading system. fx
rishijay trading system of moving averages
======================================
THANKS TO MLADEN, MRTOOLS AND XARD
and rijay @ rijay's system of moving averages
forex-station.com/viewtopic.php?f=578267&t=8473287
====================================================
create Downloads folder in indicator folder of mt4 terminal and put all indicators in this Downloads folder , and restart mt4(mt5) terminal
otherwise this templets will not work !!
mindset and risk management is the key. risk only 1-2% of your capital on each trade. risk management is how you control your lot size while trading !!
call and put options open interest levels are the real support and resistance levels, from where prices jumps and reacts.
market moves from convergence of moving averages to divergence of moving averages alternatively
moving averages to use-- 5,13(20, 13-20 ema zone decides swings), 50,200 exponential moving averages.
prices moves from point when there is convergence of moving averages
when there is convergence of moving averages, from this convergence points prices moves fast(13 ema converging on 50 ema for next swing to start)
more the convergence of moving averages of all timeframes more stronger the next move and trend will be.!!
50 ema in any timeframe is equillibrium point from where new swing begins, 50 ema acts as point of mean reversal.
so prices moves from 50 ema of one timeframe to other( see below timeframes synchronised for that) qwma is set as 50 ema of this timeframes,
5 ema, 13(13-20 ema zone), 50 ema , 200 ema does the same representation, reflecting 50 ema of corresponding higher and lower timeframes
above 50 ema(exponential moving average) and below 50 ema(exponential moving average) = above center line of macd and below center line of macd(centerline of macd=50 ema)
13 ema x 4 = 52 ( 50 ema)
so loading 13 ema of(higher timeframes) all timeframes in single chart will show 50 ema(lower timeframes) of all timeframes in single chart also
for example 13 ema H4= 50 ema H1 ( higher timeframe 13 ema = lower time frames 50 ema, (for synchronised timeframes M1,M5,M15,H1,H4)
so you are looking at 13 ema of all timeframes in this templet = you are looking at 50 ema of all timeframes
and prices bounces from 50 ema of one timeframe to 50 ema of other timeframes
50 ema is from where next move starts
================================================================================================
when all timeframes moving averages align in one direction then you have a move which is tradable. when all higher timeframes are aligned you can draw trendline and move will be available to trade at the break of the trendline in the direction of trend( in the direction of aligned higher timeframes moving averages)
you need to pay attention to price action more then on any indicators as indicators will be late to react and market is fast to move, if you want to enter on when there is signal on indicator then you will enter late and already most of the move on the swing is done with.
so basically you can trade with moving averages, trendline and price action.(higher top higher bottom and lower top lower bottom)
and then mark (with real time data of call and put )highest open interest levels of call and put options on chart as lines (this are support and resistance levels) and then use real time data of orders traded on exchange to see when this support and resistance levels are violated by large orders, once there is convergence points of moving averages appears and trendline is violated.
after convergence of moving averages is done, trendline violation is a point of entry in the direction of the higher timeframe trend.
daily, weekly, monthly, quarterly and yearly close prices are strong support and resistance levels
TIME ZONE DIVISION--
===============
-best timeframes for analysis-
-1)for instruments traded for 24 hours(factor of 4)-will be 15 minutes, 1 hour( 15 minutes X 4=60 minutes), 4 hour( 1 hour X 4= 4 hour).... like that, so 30 minutes is odd time frame to analyse , ( this will set time zone division for instruments for instruments traded for 24 hours like forex)
-2) for instruments that are traded on only during exchange open hours( usually 6 hours approximately on all exchanges, 6hours X 4= 24 hours)
(here also factor of 4) -here in this case 15 minutes time frame will equate to 1 hour time frame(60 minutes)(15 minutes x4) for instruments traded for 24 hours, and 1 hour time frame will equate to 4 hour time frame(1 hour x 4) for instruments traded for 24 hours duration, ..... so on
-----------------------------------------------------------------------------------------------------------------------------------------------------------------------------------------------------
PRICE ZONE DIVISION-
================
Apply factor of 4 on moving average to get better entry points,
basics of division- for crucial 13 , 50 ,200 ema(factor of 4 as with time zones to get synchronization with time zones)-13 ema x4=52 (50 ema), 50 emaX4= 200 ema
so on above formula,
1)for instruments traded for 24 hours- 50 ema on 1 hourly chart=13 ema on 4 hourly chart( factor of 4 for both price zones and time zones)
- 200 ema to 1 hourly chart= 50 ema on 4 hourly chart( again,factor of 4 for both price zones and timezones)
....so 0n for other time frames also
-2) for instruments that are traded on only during exchange open hours( usually 6 hours approximately on all exchanges, 6hours X 4= 24 hours)
- 50 ema on 15 minutes chart=13 ema on 1 hourly chart(60 minutes)( factor of 4 for both price zones and time zones)
-200 ema on 15 minutes chart = 50 ema on 1 hourly chart( again,factor of 4 for both price zones and timezones)
so on for other time frames also,
so this is how system is based , it revolves around on equal time and price division, magic factor here is -4
you will find now 5 minutes,15 minutes, 1 hourly and 4 hourly charts in sync with this system indicators, (30 minutes time frame will not be in sysn with the system as it does not fall into equal division of time and price zones)
----------------------------------------------------------------------------------------------------------------------------------------------------------------------------
convergence of moving averages 13 ema and 50 ema provides best entry points.
best entry points and to avoid sideways markets -- all time frame averages to converge(all higher time frame trend to align) as much as possible and then to see moving averages to converge on time frames as explained above, to minimise risk and improve reward probability.
where are low risk entry points and anticipating next fast price action
- at convergence of moving averages 13 and 50 ema( at this points there is maximum convergence of all lower timeframes with maximum compression of prices of all lower time frames, so one can anticipate price expansion ahead)
-----------------------
MOVING AVERAGES AND TIME ZONE DIVISION
( equal division of price zones and time zones by factor - 4)( to match for all crucial H4 candle closing timing, as major exchange like US, london and tokyo's session opeing and closing time falls on closing hours of H4 candles where most of moves comes)( last few moments on any candle is very important for decisive move to take place)(opening and closing time of exchanges is where volume is generated, opening price is set up by amatuer traders and closing prices on exchange is set up by professional trades)( closing prices of session is the price which is the closest to the interbank close price)
______________________________________________
___________________________________________________
50 ema Daily =13 ema Weelky = 5 ema monthly
200 ema Daily = 50 ema weekly = 13 ema monthly = 5 ema quarterly
200 ema weekly = 50 ema monthly = 13 ema quarterly =5 ema yearly
200 ema monthly= 50 ema quarterly= 13 ema yearly
-------------------------------------------------------------------------------
for instruments traded 24 hours like forex( for charts available all 24 hours)
13 ema D1 = 50 ema H4(exact is 50 ema H6) = 200 ema H1
13 ema H4 = 50 ema H1 = 200 ema M15
13 ema H1 =50 ema M15 = 200 ema M5
13 ema M15 = 50 ema M5 = 200 ema M1
-------------------------------------------------------------------
for instruments traded during exchange open time( for charts available only during exchange open time)
13 ema D1 = 50 ema H1 =200 ema M15
13 ema H1 =50 ema M15 = 200 ema M5
13 ema M15 = 50 ema M5 = 200 ema M1
______---------------------------------------
so H4 of 24 hours traded instruments = H1 of instrument traded only on exchange hours
so H1 of 24 hours traded instruments = M15 of instrument traded only on exchange hours
--------------------------------------------------------------------------
so match H4 chart of forex (24 hours chart) to H1 chart of same forex pair with chart available during exchange open time, for better execution when both charts align you have a move available to trade
-----------------------------------------------------------------------------------------
________________________________________________________________________________________________________________________________________________________________________________________________________________________
note- M30 is the oddest time frame to trade, avoid trading on this time frame.
-----------------------------------------------------------------------------------------------
zone between 13 ema and 20 ema is all important for short term swing to end, if prices dips below this zone and does not come back above it fast in next few candles , brace for reversal to come and break of this 13 ema and 20 ema zone will flip atr of prices to other side.( usually with large and fast price action bar that will less likely to reverse as it breaks multiple timeframe averages, in one bar, and catches all traders to wrong side and sets panic in traders to make them square off their positions )
------------------------------------------------------------------------------
in all time frames 50 ema is the equilibrium point, from where next price action begins and price strength comes
50 ema = 50 level on rsi (14) = centerline of macd= centerline of stlm histogram
--------------------------------------------------------------------------------------------------------------
as 13 ema and 20 ema zone is all important, as start and end of swing, it is all about convergence and divergence of this zones in multiple timeframes(qwma set as this 13-20 ema zones, loaded all timeframes qwma in single chart = all timeframes swings in single chart)
price action is of paramount importance for break of trendline(on closing basis) and for initiation of trade., around 70 % of times prices will pull back towards trendline to give better entry points after prices breaks trendline on closing basis of candle( this candle should be a large one and fast one)( to catch traders on wrong side suddenly and offguard, so that panic sets in the traders (counter trend traders and sideways market traders)and they rush in to square off their positions. at convergence of moving averages before prices starts its next move, it forms double top or double bottom commonly (and this tops are where stop loss should be) and then runs to break trendline.
rough estimate of targets-- length of consolidation ( draw horizontal line of length of consolidation and put the same line on vertically, ) that is your minimum targets.
prices tend to pull back towards the previous days close prices often before resuming its move for the day, as previous days close price is the most important for major banks,( interbank close), so is very important is the close at US market closing prices,
and exchange close price for stocks and indexes
for any country's currency, two close price are important
one is where is the close price on that country's interbank platform close. and other is where is close price of that country's currency on US session close(as that is decisive for daily candle close)
depending on how is closing on us session , the next day prices will open on that country's interbank platform and then will pull back to the previous day's close price on that country's interbank platform, and then again restart the move for the day in the direction of the trend.
this is also true for any other instrument like stocks and indexes
only in <10% of the time when there is very strong trend that this pull back to country's interbank close price level will be shallow.
price and volume move will come at
london open
tokyo close
us open
london close
us open
reliable volume is generate when there is interbank or market closing and opening hours overlap on major country sessions, that synchronizes with H4 candle close, and that is when good price action is anticipated.
like, tokyo close and london open overlap
london close and us open overlap
us close.
now H4 trend changes when lower timeframes starts aligning, like slowly 15 minutes, 16 minutes, 17 minutes, 18 minutes..............H1,H2, H3 timeframes slowly starts aligning in one direction (this is what histogram shows)
when all lower timeframes aligned, there appears big and fast price bar on chart and throws atr of prices(and so moving averages ) of all lower timeframes to other side as all timeframe crucial moving averages are breached in single bar, this large price bar sets panic among traders as they are now caught off guard and rush to close positions, this propels the reversal on chart in form of fast and large price action bar, mostly running fast to breach trendline
this reversal also gets reflected on macd histogram as cross of histogram above or below zero line(or cross of macd line and macd signal line)
so now the option to find out when trend is going to change and anticipate trend change coming is -one assess all lower timeframes below H4 turning on multiple timeframes chart like H3,H2,H1 ..... or to see on single chart with macd histogram of H4 timeframe, .( now with jurik smooth ribbon showing all timeframe trend in single chart of all timeframes i need not open all chart below H4 to see when they are aligning using qwma on single chart.
so one option is to synchronize all time frames in one single chart to see what is going on in diffenet timeframes and read it on one chart( like with qwma in above templets)
or the other option is to analyze all timeframes chart one by one to see what is status of trend on different timeframes.
so when macd line and macd signal line touches each other, that shows that all lower timeframes have reached alignment and big price bar is coming soon, direction of which is set by higher timeframe trend.
now if this all timeframe trends have aligned at points of convergence points of moving averages in multiple timeframes, then divergence with large price action bar is coming( good entry points at convergence points)
do not take trades when there is divergence of moving average already done, as this will again mean align to equilibrium point 50 ema in counter trend way retracement, again wait for convergence points on moving averages to appear.
now as both macd and stlm histogram are slow to react to price action as any other indicator and market is fast, so for entry i use price action( as above all timeframens aligns at convergence points , anticipate big price action in direction of trend, but this is just anticipation, and draw a trendline from one macd line cross point to other cross point, means lower timeframes strength points to lower timeframes weakening point,, once prices starts running fast with big price bar running to break trendline, that means all counter trend traders and sideways market traders are now stuck, be ready to open up position at break of trendline, prices usually stops at trendline after candle closes, and gives good entry point there, trendline break confirms reversal
timeframes that can be coupled are H4-H1, H1-M15, M15-M5, M5-M1, which ever timeframe you are trading, M30 does not fit with macd and moving averages atr of prices(13-20 ema zone on each timeframe)
-----------------------------------------------------------------------------------------------------------------
more the timeframes aligned more stronger move is expected.
more the higher timeframes aligned, more longer trend will emerge.
--------------------------------------------------------------------------
find out convergence points on instruments that is trending and then take trade as explained above.
loading moving average as posted previously or loading qwma adaptive fls(previously posted templet and indicators here on this thread) shows convergence points in all timeframes in single chart
stlm histogram and macd are for momentum change showing and multiple timeframe alignment only,
entry to trade is with price action , as price candle displays much information, and only take positions in trending market and only in direction of trend, so that even entry is bit wrong trend will take care of it.
spikes that comes above or below this convergence points (before start of move), on moving averages will not be tested if i have taken right trade and position will be in profit immediately
.
if macd lines have fallen too far away from its centerline, price most likely will not cross back 50 ema immediately, it will first come back and mean reverse to 50 ema and consolidates there and then will try to attempt to cross it.
market moves for convergence to divergence and macd shows the same , market is that regular in its behaviour from alternate convergence and divergence. higher time frames decides in which direction next convergence and divergence will come
moving averages
5, 13(13-20 ema zones), 50 and 200 ema (as it is more synchronized with time frames H4, H1, M15, M5 and M1)
---------------------------------------------------------------------------------------------------------------------------------------------
200 ema to find long term trend, 50 ema to find medium trend, 13-20 ema to find swings, and 5 ema( or macd line ) to catch price action(or just use purely price action reading)
for example of H4-H1 trading
for catching H4 swings, 13 ema H4 (13-20 zones) will catch it.
now H4 13 ema = 50 ema on H1 chart, so till prices are above 50 ema of H1 chart you are in upswing on H4 chart , any move towards 50 ema on H1 chart is buying opportunity.
----------------------------------------------------------------------------
reverse for down swing
macd lines-
macd line = 5 ema
macd signal line =13 ema
macd center line=50 ema
- so H1 upswing starts with up cross of macd line and macd signal line on H4(i.e upcross of 5 ema and 13 ema cross of H4= 13 ema and 50 ema upcross on H1) ,and ends with down cross of macd line and macd signal line cross of H4 (i.e downcross of 5 ema and 13 ema cross of H4= 13 ema and 50 ema down cross on H1)
in between pullbacks of prices on 50 ema H1(= 13 ema H4= 100 ema M30= 200 ema M15) are buying opportunities
price strength will emerge when macd line crosses its centerline
it is when higher timeframes moving averages align( for upswing in this sequence yearly, quarterly, monthly, weekly, daily, H4, H1 when all moving averages align in up direction you will have a move in lower timeframes) , that is when lower timeframes moves.
qwma set to show all timeframes swing zones and find out convergence of moving averages points in multiple timeframes
qwma set to match 13-20 ema zones.
with above posted indicators added.
if you want to see all timeframes swings in single chart
----------------------------------------------------------------------------------
this zones 13-20 ema zones are the ones from which prices react
and this zones are potential target areas.
convergence points are entry points in direction of higher timeframe zones.
ultimately its the context of moving averages in all timeframes , each moving average represents a timeframe
macd just represents convergence and divergence of moving averages only
13 * 4=52 ema( 50 ema)
15 minutes * 4 = 60 minutes
so multiplication or division by factor 4 is equal division of moving averages and timeframes
algo or program trading does not change the overall market structure , it is just a faster execution of orders but then at which point in history was mr. market slow !! algo are run in direction of the trend.
---------------------------------------------------------------------------------
qwma indicator setting
ma period = 25
ma speed = 2.5
average price =close
average speed should be adaptive = true
level type= quantile level
floating levels period =5
color change on = change color on outer levels cross
---------------------------------------------------------------------------------------
t3moving average ribbon indicator settings(as macd on chart)(mtf mode )-
t3period 1 = 5
t3hot 1= 0.2
t3 price 1= close price
t3original 1= true
t3period 2 = 11
t3hot 1= 0.63
t3 price 1= close price
t3original 1= true
--------------------------------------------------------------------------------------------------------------
========================================================================
ma_-_ribbon_2_2 indicator color ribbon settings.(MT5)
1)
fast time frame = 1 day
fast ma period = 13
fast ma methoe = exponential moving average
fast ma price = close
slow time frame = 1 day
slow ma period = 50
slow ma methoe = exponential moving average
slow ma price = close
colors ma ribbon= navy and firebrick
---
overlap second copy of indicator with following settings
2)
fast time frame = 4hours
fast ma period = 13
fast ma methoe = exponential moving average
fast ma price = close
slow time frame = 1 day
slow ma period = 13
slow ma methoe = exponential moving average
slow ma price = close
colors ma ribbon= navy and firebrick
---
overlap third copy of indicator with following settings
3)
fast time frame = 4hours
fast ma period = 1
fast ma methoe = exponential moving average
fast ma price = close
slow time frame = 4 hours
slow ma period = 13
slow ma methoe = exponential moving average
slow ma price = close
colors ma ribbon= 83,83,255 and 255,106,106
===============================================================================
--------------------------------------------------------------------------------------------
MTF_MCP_Price_MA_Difference indicator settings
50 period exponential moving average
Attached Image(s) (click to enlarge)
Attached File(s)