Note: This strategy works best when EUR/USD and EUR/JPY are trending up or down. The strategy is no good when the Euro is channeling sideways.
There are three essential criteria that need to be synchronized for the best possible outcome. They are:
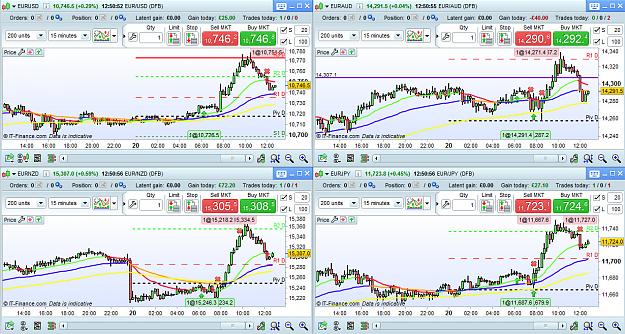
- EUR is strong against all other currencies for long trades. (Weakest for short trades).
- All chosen EUR pairs are trending in the same direction.
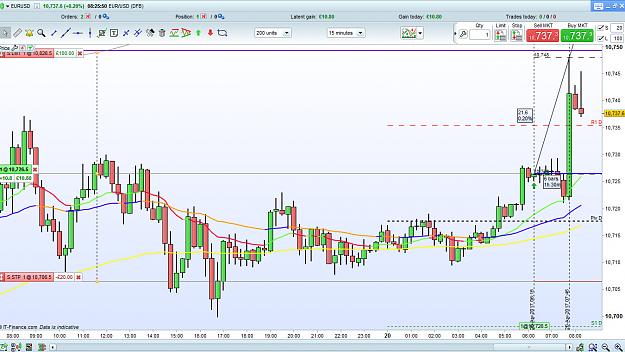
- The 7 am candle for each selected pair on a 15 M time frame are all pointing in the same direction (up for longs and down for shorts).
Here are the strategic steps to follow:
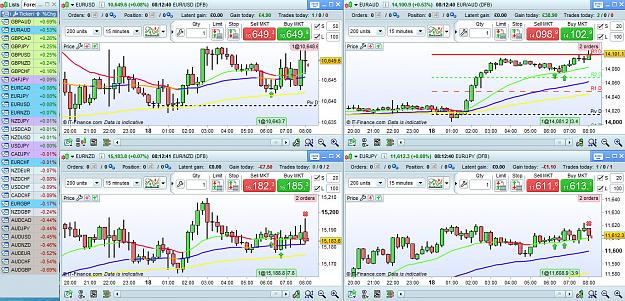
- At 6:30 am (GMT) check the currency strengths using a simple H/L leader list as shown in the example chart below (EUR pairs are coloured blue). If the EUR/USD is in the upper quadrant of the list and is seen to be rising since midnight (GMT) the indication is to go long. If the pair is in the lower quadrant then the indication is to go short. Best results are when the EUR pairs are grouped together at the top (for long trades) or at the bottom (for short trades). Important note 1: If price has reached a new high or a significant resistance level there is a very high probability that price will retrace. Watch the 7 am candle for the signal to go short.
- Check the major trend using 100 MA on a 15 Minute chart. Use a 20 MA, 50 MA and 100 MA moving averages and daily pivots. Make sure that the four pairs you have chosen are moving in synchronicity (they all have the same shape and trend). If the trend is up go long and if the trend is down go short. Best results are when price is above the daily pivot, 100 MA and 50 MA for long trades and below these indicators for shorts.
- Important note 2: If you can't identify a strong trend or price is channeling sideways - stay out.
- Wait for the 07:00 - 07:15 am candle. If the candle points in the same direction as the trend on all four pairs then trade in that direction. Important note 3: If there is no agreement in all four pairs of the direction of the 7 am candle - stay out. Do not trade.
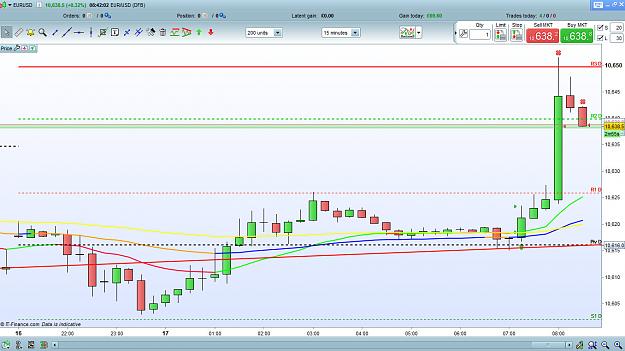
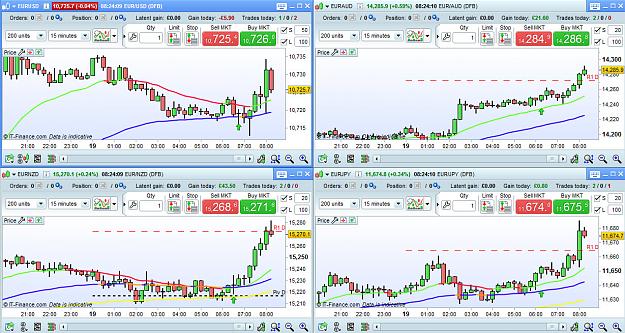
- There will normally be a bullish bar at about 7 am for long trades or a bearish bar for shorts. This is your primary indicator. You can catch it with a stop order. If you miss it, wait for the pullback. I have learned to call this 7 am bar the 'truth' bar. Whatever else may be happening with any other indicator, this 7 am bar will point in the direction of the coming move, but only if there is agreement with all your selected pairs. The simple strategy is to follow the direction it points to get into your position. Which pair you choose to trade is up to you. When there is good synchronicity I personally trade all four selected pairs.
- After the 7 am bar, there is often a pullback or a pause until about 7:30 (sometimes as late as 07:45) when the move will resume right through to a spike at 08:00 am.
- You can be cautious by placing a buy stop order above the last bar of the pullback on a 15 M chart, or a sell stop order below the rising pullback for shorts. If you are using a 5 M time frame, the pullbacks can be a bit scary, but consider the action of throwing a ball. You bring your arm back before you throw, and this is a similar action. The stop orders will remove any risk if the pullback turns out to be a reversal, which is unlikely if you do follow the direction of the 7 am 'truth' bar.
- I use a 25 pip target with a 20 pip stop for a scalp trade.
- Never hold onto a position when there is a pending high impact news release or you will get stopped out by a whipsaw.
Perfect set-ups for this strategy don't appear every day, but as time progresses I shall post examples of good trades where the set-up criteria have been met, together with examples of when to stay out. Any questions you may have should be answered simply by looking at the charts posted.
Polite notice: Please check past charts for answers to your questions rather than clutter the thread with continuous questions.
Thank you for taking an interest and I hope and trust that this thread will be useful to you all. (It will only if you follow the strategic rules). If it works for you please give your vote in the poll and pass it on to others.
Successful trading to all.![]()
![]()
![]()
The chart for 18th shows 4 pairs with the currency strength list, but the strong GBP meant that momentum was lacking, but the second chart for the 17th shows good momentum and a closer look at the 7 am 'truth' bar.