This thread is set up in such a way that you have to read it to get the GOLD within. No single post contains all the jewels. All those who spent time reading it are happy today!
For the theory of transient zones, go to http://www.forexfactory.com/showthread.php?t=434603&page=286
Hello People:
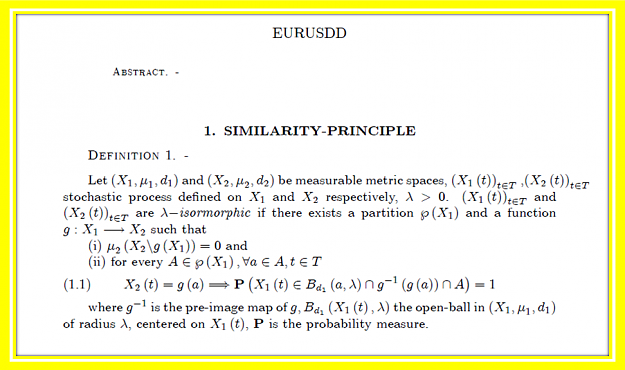
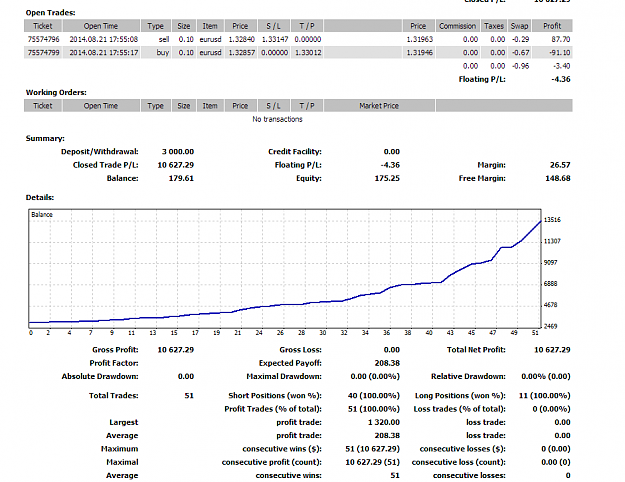
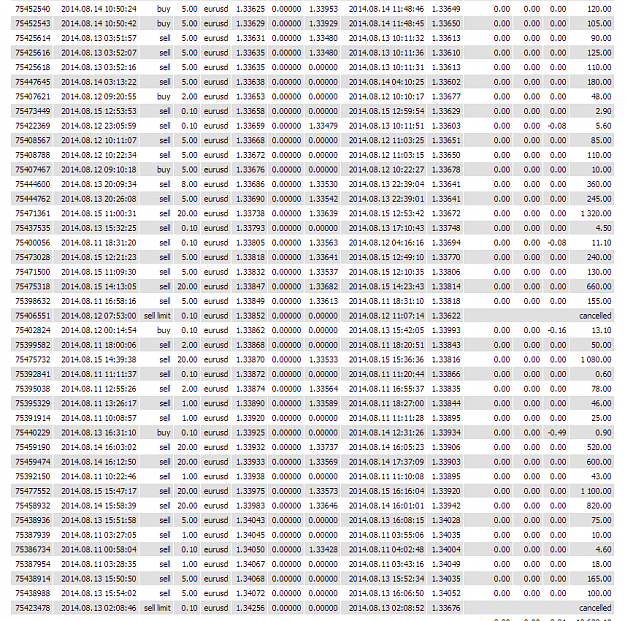
I don't know if I can call this a system but there is a deep-mathematical support for what you are about to read. I will not 'bore' you will a lot of things you already know and initially I opened a demo-account for the EXPLORER section but I may not have the time to trade it daily at this time. Therefore, I waNT all of you to have a basic idea of the principle underlying this thread. The demo-account(EXPLORER) EURUSDpips that I opened grew from $3,000 to $21,302 within 5 days before I closed it today! I also traded heavy lots (8 lots) on such a little account in order to prove to you that the principle is sound. 23 trades, 1 loss, 20 wins.
The are many parts to my trading strategy, however there is one part that everyone can test and master. The SIMILARITY-TRICK!
There are two ways to apply/use the trick.
1: Across brokers, same time-frame, same currency pair
2: same broker, same currency pair, compatible time frames.
Best Compatible time-frames are 1: 1min-5min, 5min-15min, 15min-30min, 30min-1hr, 1hr-4hr, 4hr-1day, 1day-1week. For day-traders, 1min-5min, 5min-15min, 15min-30min, 30min-1hr will be sufficient!
Once you have chosen your currency pair, and compatible time-frames you need to chosen indicators that alert you on important patterns on the chart. IT DOES NOT MATTER if the indicators you chose repaint or not!
For the purpose of the thread, I will use 1min-5min and indicators that everyone can get!
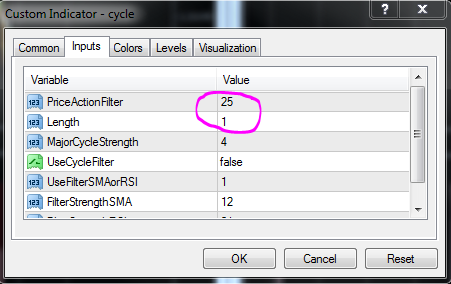
There are very good ways to spot loop-holes in the market but a crude way is the use the cycle-identifier indicator. You can easily get it online. You may have to tweAK the code a little so that the indicator does not 'clear-itself' like it usually does when new data point comes in.
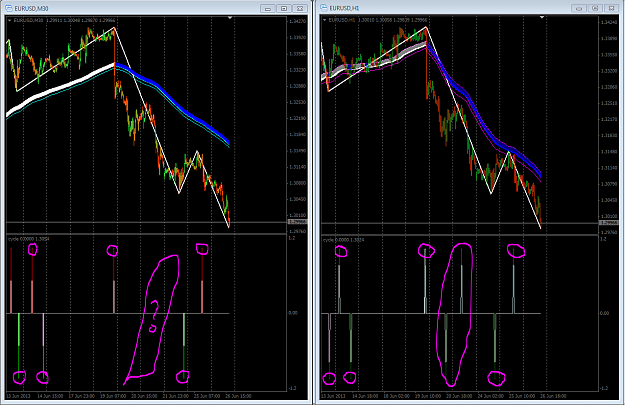
Then you need to make sure your 1min and 5min charts look VERY SIMILAR like the one below.
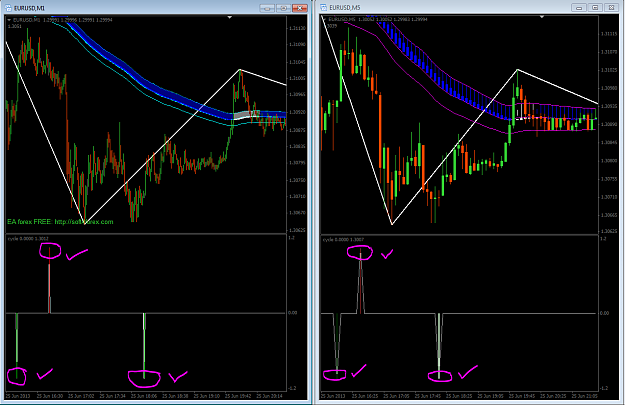
Do you see the cycle indicators on the 1min and 5min charts agreed?
Since the indicators are set in such a way that they should agree >90% of the time, as soon as you spot a difference, like the case below, you are in for a high-probability trade!
Furthermore, since both chart must agree >90% of the time, once the cycle on the 1min/5min chart is telling you something and the cycle on the 5min/1min chart does not show the same stuff, you need to pay attention to you chart!
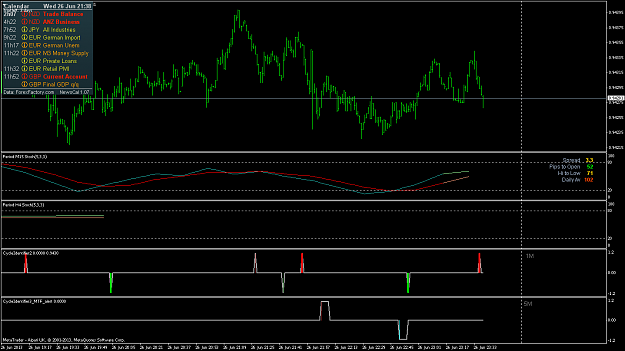
Another example of aggreement 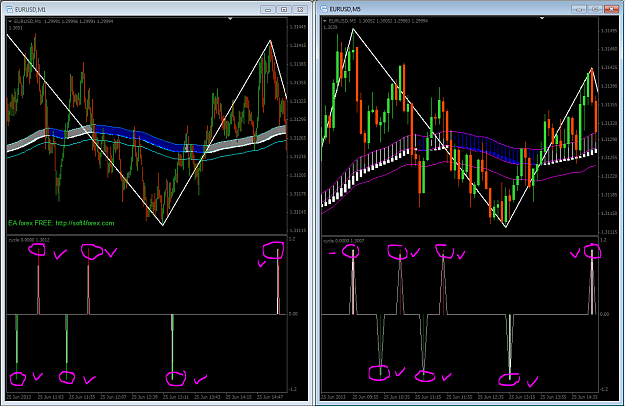
Look at this difference!!! Since both chart must AGREE within a maximum interval of 5 minutes, any time the 5min bar closes and the cycles do not agree, the chart showing the difference gives you the trade signal. In the example below, the 1min chart gave the trade signal after the 5min candle closed without a similarity! Details later. 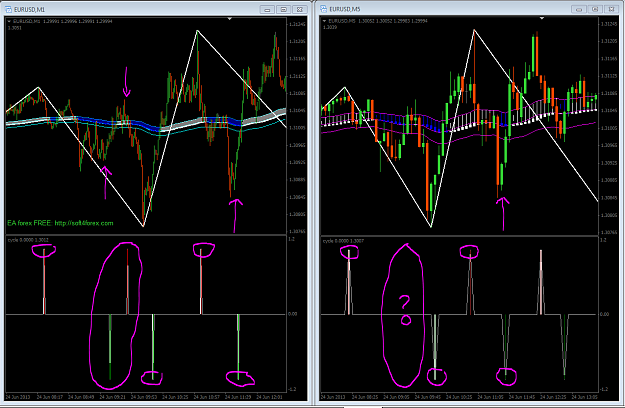
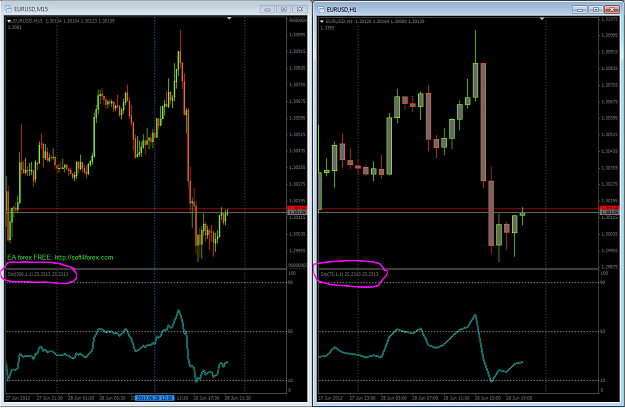
The cycle-identifier is a repainting indicator and the least used in the similarity system! The next indicator is the stochastic indicator! This one is SUPER but you need to watch your chart cause once you get the signal, you are in for a big ,,,,,,,,,,
lOOK at the two reading in the indicator window! I will explain this approach next week!
Eurusdd, Professional Scammer
For the theory of transient zones, go to http://www.forexfactory.com/showthread.php?t=434603&page=286
Attached Image (click to enlarge)
Attached Image (click to enlarge)
Attached Image (click to enlarge)
Hello People:
I don't know if I can call this a system but there is a deep-mathematical support for what you are about to read. I will not 'bore' you will a lot of things you already know and initially I opened a demo-account for the EXPLORER section but I may not have the time to trade it daily at this time. Therefore, I waNT all of you to have a basic idea of the principle underlying this thread. The demo-account(EXPLORER) EURUSDpips that I opened grew from $3,000 to $21,302 within 5 days before I closed it today! I also traded heavy lots (8 lots) on such a little account in order to prove to you that the principle is sound. 23 trades, 1 loss, 20 wins.
The are many parts to my trading strategy, however there is one part that everyone can test and master. The SIMILARITY-TRICK!
There are two ways to apply/use the trick.
1: Across brokers, same time-frame, same currency pair
2: same broker, same currency pair, compatible time frames.
Best Compatible time-frames are 1: 1min-5min, 5min-15min, 15min-30min, 30min-1hr, 1hr-4hr, 4hr-1day, 1day-1week. For day-traders, 1min-5min, 5min-15min, 15min-30min, 30min-1hr will be sufficient!
Once you have chosen your currency pair, and compatible time-frames you need to chosen indicators that alert you on important patterns on the chart. IT DOES NOT MATTER if the indicators you chose repaint or not!
For the purpose of the thread, I will use 1min-5min and indicators that everyone can get!
There are very good ways to spot loop-holes in the market but a crude way is the use the cycle-identifier indicator. You can easily get it online. You may have to tweAK the code a little so that the indicator does not 'clear-itself' like it usually does when new data point comes in.
Then you need to make sure your 1min and 5min charts look VERY SIMILAR like the one below.
Attached Image (click to enlarge)
Do you see the cycle indicators on the 1min and 5min charts agreed?
Since the indicators are set in such a way that they should agree >90% of the time, as soon as you spot a difference, like the case below, you are in for a high-probability trade!
Furthermore, since both chart must agree >90% of the time, once the cycle on the 1min/5min chart is telling you something and the cycle on the 5min/1min chart does not show the same stuff, you need to pay attention to you chart!
Another example of aggreement
Attached Image (click to enlarge)
Look at this difference!!! Since both chart must AGREE within a maximum interval of 5 minutes, any time the 5min bar closes and the cycles do not agree, the chart showing the difference gives you the trade signal. In the example below, the 1min chart gave the trade signal after the 5min candle closed without a similarity! Details later.
Attached Image (click to enlarge)
The cycle-identifier is a repainting indicator and the least used in the similarity system! The next indicator is the stochastic indicator! This one is SUPER but you need to watch your chart cause once you get the signal, you are in for a big ,,,,,,,,,,
lOOK at the two reading in the indicator window! I will explain this approach next week!
Attached Image (click to enlarge)
Eurusdd, Professional Scammer