I've been working on a new system since late October. It needs a fair amount of work, so if you are looking for something that is a complete black box, holy grail... THIS IS NOT IT. I am posting here because I've learned tons from others here. Between the generosity of other posters here and other skills (price action and support and resistance as per James 16) I have managed to more than double my demo account since 27 October.
What I am about to present has been a huge contributor to that track record, but I would have lost money had I only been using it. Still, I think it has a lot of potential, because the winners way out number the losers. Again, that is NOT enough to make this profitable. My risk reward ratio is completely unacceptable by almost any standard. I've been using this in a demo account though, so I'm not worried. If you play with it in a demo account you too will not be worried... If you are so foolish as to run this on a live account YOU ARE A BLOODY FOOL.
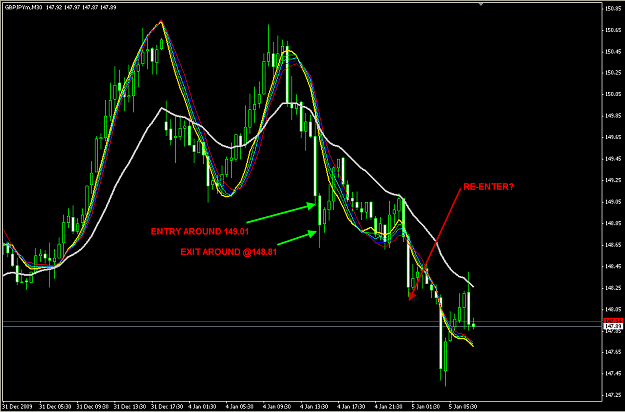
All of that being said, what I've succeeded in doing is using this system to generally find safe entries into the market. Where the market occasionally turns and bites me (takes my stop loss) I now know I have a day where I'll need to go to work, but the market does oblige on these days. Whether it comes back for a re-entry, or runs off the other way, or gets stuck in a range, those are the days that I have to try something else to make back my pips.... but it seems that I'm becomming successful at that finally. It's just that I can't pay that kind of attention to the market every day. So, typically a couple days out of every 2 or 3 weeks, the market doesn't cooperate with this system. That kills it as a system as you will see. But I am hopeful that some of the fine minds here might help come up with some filters that can better limit trading on the losing days while keeping all or most of the winning days, and possibly turn this into a real winner.
So here we go.
I trade this on the GPBJPY 30 minute chart.
Use the TSF indicator provided. I attach one each for periods 19,20,21,22,23 -- you can set the colors to whatever you like, but be sure the 19 period is different from the rest.
I also attach a 20 period EMA of the close.
Do not trade any bar between midnight GMT and 1am GMT. However, you will begin analysis with the close of the 1am bar.
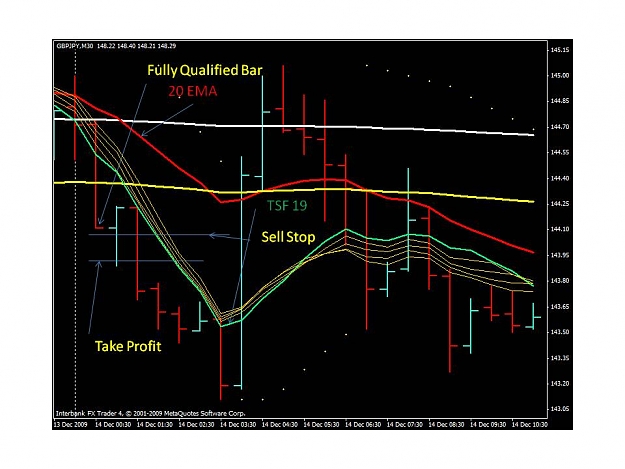
The TSF lines must all be above or below the 1am bar. If they are not you cannot trade until they do. This filter is valid only at the beginning of the trading day. Once it is cleared at a bar close, it is not applied forward from that.
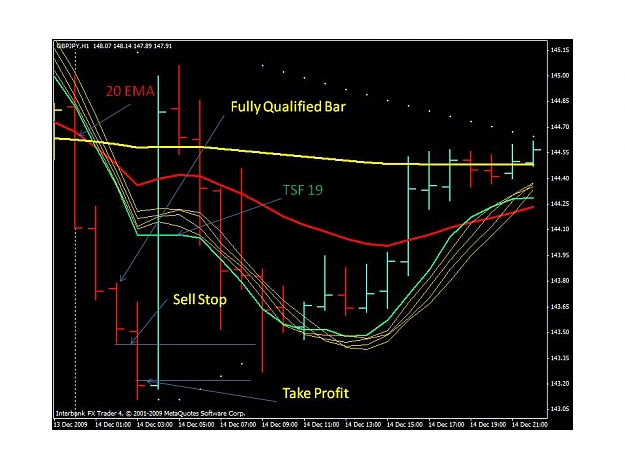
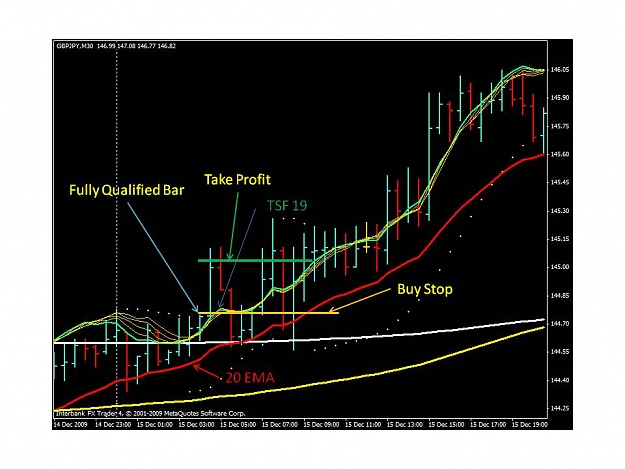
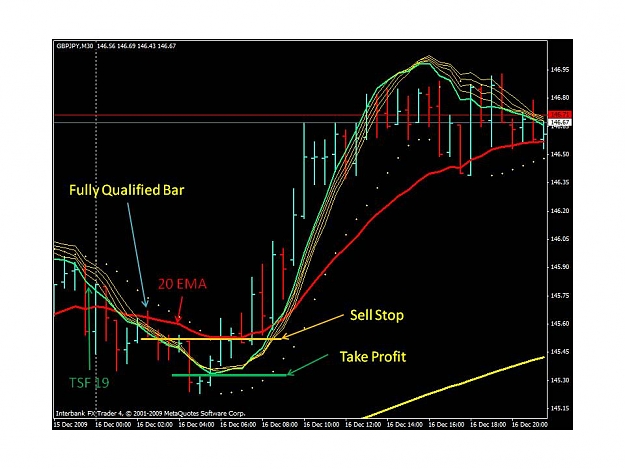
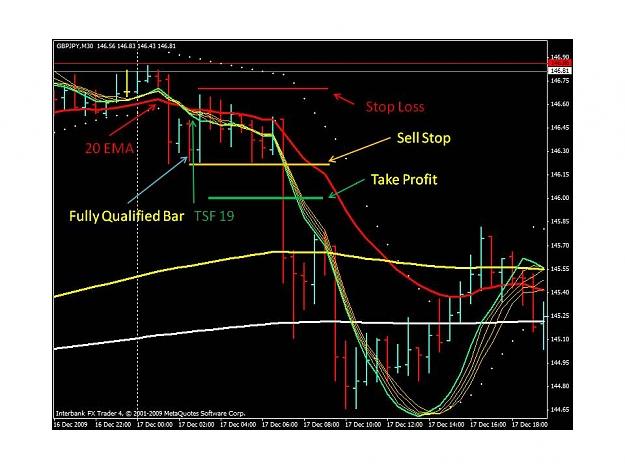
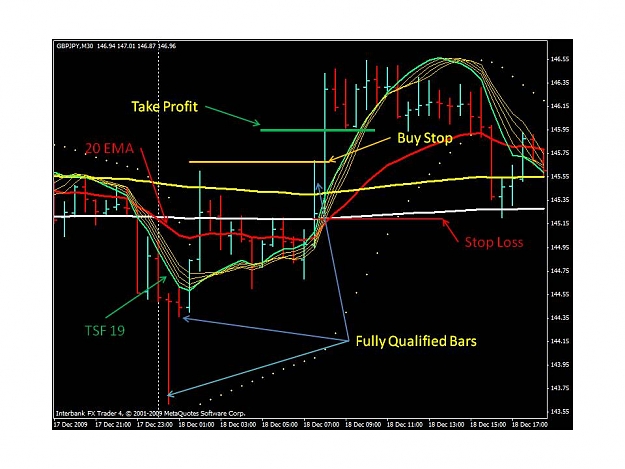
The TSF 19 must be the highest TSF and above the 20 EMA, and the bar must have closed even or up, for a valid buy trade setup. Conversely, it must be the lowest TSF and below the 20 EMA, and the bar must have closed even or down, for a valid sell setup.
When the setup is confirmed, place a buy stop or a sell stop with the trend specified by the 19 TSF.
I place buy orders 1 pip above the close of the previous qualified bar, plus the spread (I figure 6 pips for my broker IBFX). Sell orders are placed at 1 pip below the low when that previous bar qualifies.
If the entry is not triggered, and there is a better entry bar that forms later, I will make the change ONCE. I won't chase it after that as there is a high probability you will eventually get executed for a loss.
My take profit is 20 pips. My stop loss is 51 pips. As a general rule I only look for the first qualifying trade for the day. If I lose, I know I have to work some other ways to get it back. So far I've not had a single losing day, considering my fallback actions, which I can't possibly attempt to explain. I am risking a total of 6% on a trade. I am testing. You may use whatever settings you want.
Perhaps some other TSF settings, or some other EMA settings might work better for you.... or some other filter... stop loss, take profit.... timeframe.... whatever.
I'm simply stating that this is easy pickings around 80% or better, each month. I have learned that there are more losses that seem to occur on GBP rate change statement days, and when the notes from the Bank of England are released. Rate statement is made on the Thursday of the first full week of each month, and the notes/minutes of the meeting are released on the Wednesday two weeks later. Trading on those days runs about 50% losses I think (so you can still win... but odds are not in your favor). Other losing days are harder to nail down. They look pretty normal a lot of the time. Narrow early trading does NOT corralate to less wins. It actually seems to be easier to win in that environment.
I want to post some pictures to make it clearer, but it might be a day or two before I get to that.
If anyone wants to try to make an EA that will watch and place an initial order I would really appreciate that. Also might be nice to build an indicator that could be attached and show where qualified trades occured and what the result was. That way, we could visually see what the effect of changing the settings for the current set of indicators are, and maybe get a better sense of what could be improved.
Let me know what you all think. As I said, I'll try to post some stuff a bit later.
I have looked at other pairs for this. It probably works with other TSF and EMA settings, but I've only been experimenting with these on GBPJPY. I am more familiar with this pair. You should feel free to experiment.
The key here is that we aren't trying to catch the very start of a trend, we just want to find a good safe place to enter. That is what these indicators help to do. Sometimes the signal comes VERY far into a move, and that is okay... isn't it.
What I am about to present has been a huge contributor to that track record, but I would have lost money had I only been using it. Still, I think it has a lot of potential, because the winners way out number the losers. Again, that is NOT enough to make this profitable. My risk reward ratio is completely unacceptable by almost any standard. I've been using this in a demo account though, so I'm not worried. If you play with it in a demo account you too will not be worried... If you are so foolish as to run this on a live account YOU ARE A BLOODY FOOL.
All of that being said, what I've succeeded in doing is using this system to generally find safe entries into the market. Where the market occasionally turns and bites me (takes my stop loss) I now know I have a day where I'll need to go to work, but the market does oblige on these days. Whether it comes back for a re-entry, or runs off the other way, or gets stuck in a range, those are the days that I have to try something else to make back my pips.... but it seems that I'm becomming successful at that finally. It's just that I can't pay that kind of attention to the market every day. So, typically a couple days out of every 2 or 3 weeks, the market doesn't cooperate with this system. That kills it as a system as you will see. But I am hopeful that some of the fine minds here might help come up with some filters that can better limit trading on the losing days while keeping all or most of the winning days, and possibly turn this into a real winner.
So here we go.
I trade this on the GPBJPY 30 minute chart.
Use the TSF indicator provided. I attach one each for periods 19,20,21,22,23 -- you can set the colors to whatever you like, but be sure the 19 period is different from the rest.
I also attach a 20 period EMA of the close.
Do not trade any bar between midnight GMT and 1am GMT. However, you will begin analysis with the close of the 1am bar.
The TSF lines must all be above or below the 1am bar. If they are not you cannot trade until they do. This filter is valid only at the beginning of the trading day. Once it is cleared at a bar close, it is not applied forward from that.
The TSF 19 must be the highest TSF and above the 20 EMA, and the bar must have closed even or up, for a valid buy trade setup. Conversely, it must be the lowest TSF and below the 20 EMA, and the bar must have closed even or down, for a valid sell setup.
When the setup is confirmed, place a buy stop or a sell stop with the trend specified by the 19 TSF.
I place buy orders 1 pip above the close of the previous qualified bar, plus the spread (I figure 6 pips for my broker IBFX). Sell orders are placed at 1 pip below the low when that previous bar qualifies.
If the entry is not triggered, and there is a better entry bar that forms later, I will make the change ONCE. I won't chase it after that as there is a high probability you will eventually get executed for a loss.
My take profit is 20 pips. My stop loss is 51 pips. As a general rule I only look for the first qualifying trade for the day. If I lose, I know I have to work some other ways to get it back. So far I've not had a single losing day, considering my fallback actions, which I can't possibly attempt to explain. I am risking a total of 6% on a trade. I am testing. You may use whatever settings you want.
Perhaps some other TSF settings, or some other EMA settings might work better for you.... or some other filter... stop loss, take profit.... timeframe.... whatever.
I'm simply stating that this is easy pickings around 80% or better, each month. I have learned that there are more losses that seem to occur on GBP rate change statement days, and when the notes from the Bank of England are released. Rate statement is made on the Thursday of the first full week of each month, and the notes/minutes of the meeting are released on the Wednesday two weeks later. Trading on those days runs about 50% losses I think (so you can still win... but odds are not in your favor). Other losing days are harder to nail down. They look pretty normal a lot of the time. Narrow early trading does NOT corralate to less wins. It actually seems to be easier to win in that environment.
I want to post some pictures to make it clearer, but it might be a day or two before I get to that.
If anyone wants to try to make an EA that will watch and place an initial order I would really appreciate that. Also might be nice to build an indicator that could be attached and show where qualified trades occured and what the result was. That way, we could visually see what the effect of changing the settings for the current set of indicators are, and maybe get a better sense of what could be improved.
Let me know what you all think. As I said, I'll try to post some stuff a bit later.
I have looked at other pairs for this. It probably works with other TSF and EMA settings, but I've only been experimenting with these on GBPJPY. I am more familiar with this pair. You should feel free to experiment.
The key here is that we aren't trying to catch the very start of a trend, we just want to find a good safe place to enter. That is what these indicators help to do. Sometimes the signal comes VERY far into a move, and that is okay... isn't it.