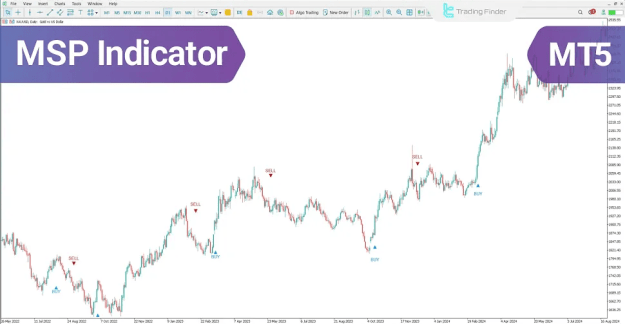
The MSP Indicator MT5 is a technical analysis tool designed to track market volatility and identify critical trend reversal points by analyzing the strength and direction of price movements. Beyond highlighting optimal entry points based on momentum, it can serve as a signal filter to enhance the accuracy of other trading strategies.
 You can download it from this link:
https://cdn.tradingfinder.com/file/5...5-by-tflab.zip
 You can also access the MetaTrader 4 version of this Indicator through this page:
https://www.cryptocraft.com/thread/1...-for-mt4-tflab
 For instructions on how to install:
https://www.forexfactory.com/thread/...-in-metatrader
Prop Firm DrawDown Protector : Prop Firm Capital Protection Expert MT5 |Forex Money Management: Forex Trade Management Expert MT5 | ICT Concepts Indicator MT5 |Smart Money Concepts Expert MT5 | Smart Money Trap Scanner | Get a free Expert Advisor license via Telegram and WhatsApp
Overview
Using the Average True Range (ATR) with a 14-period setting, the MSP Indicator calculates the average price range from previous candle highs and lows.
https://cdn.tradingfinder.com/file/5...5-by-tflab.zip
https://www.cryptocraft.com/thread/1...-for-mt4-tflab
https://www.forexfactory.com/thread/...-in-metatrader
Inserted Video
Prop Firm DrawDown Protector : Prop Firm Capital Protection Expert MT5 |Forex Money Management: Forex Trade Management Expert MT5 | ICT Concepts Indicator MT5 |Smart Money Concepts Expert MT5 | Smart Money Trap Scanner | Get a free Expert Advisor license via Telegram and WhatsApp
Overview
Using the Average True Range (ATR) with a 14-period setting, the MSP Indicator calculates the average price range from previous candle highs and lows.
- Buy Signal: When price rises above the ATR average, a blue arrow appears, indicating a potential uptrend.
- Sell Signal: When price falls below the ATR average, a red arrow appears, signaling a potential downtrend.
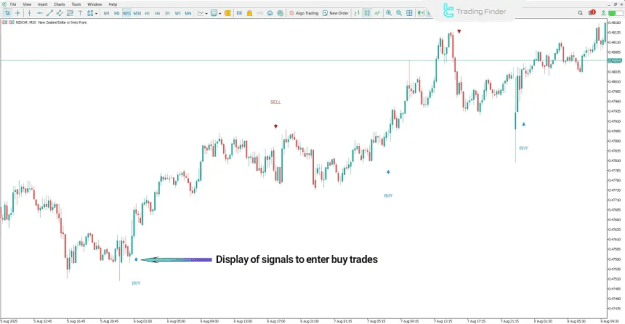
Uptrend Example
- Currency Pair: NZD/CHF on a 15-minute chart
- A blue upward arrow with “BUY” shows increasing buyer momentum and the start of a bullish trend.
- This defines a clear buy entry zone.
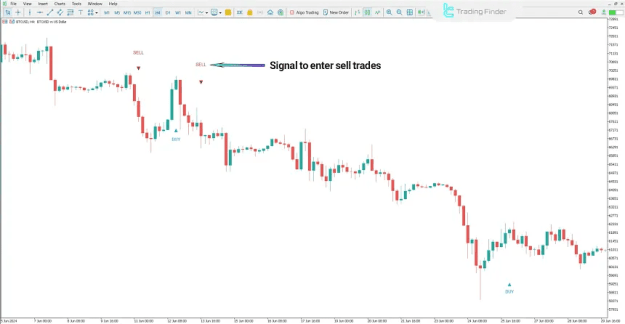
Downtrend Example
- Asset: Bitcoin (BTC/USD) on a 4-hour chart
- A red downward arrow with “SELL” signals rising selling pressure and the initiation of a bearish trend.
- This provides a reliable short entry opportunity.
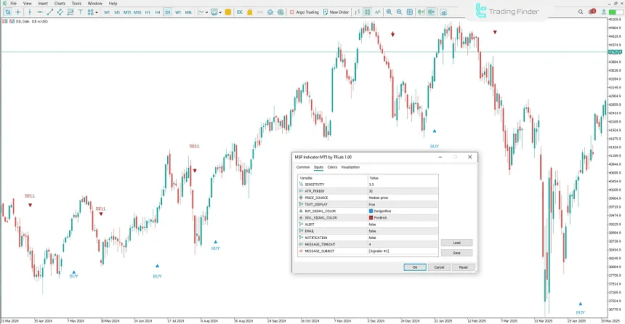
Customizable Settings
The MSP Indicator on MetaTrader 5 allows traders to fine-tune analysis with options such as:
- Sensitivity: Adjust market responsiveness
- ATR Period: Set ATR calculation length
- Price Source: Define the data used
- Text Display: Show or hide signal text on chart
- Buy/Sell Signal Colors: Customize arrow colors
- Alerts: Popup, email, or push notifications
- Message Timeout & Subject: Configure alert duration and title
Conclusion
By integrating momentum analysis and volatility measurement, the MSP Indicator helps traders accurately determine entry and exit points. Its focus on buyer and seller strength enables early detection of bullish and bearish trends, using clear blue and red arrows, making it effective for intraday and multi-timeframe trading.
Attached Image(s) (click to enlarge)