"Power of Two" is a strategy designed for traders with limited time or those frustrated with low strike rates. This strategy focuses on two currency pairs (EUR/USD and GBP/USD) and uses two time frames (4-hour and 15-minute) for analysis. It relies on two indicators: fractal highs and lows for directional bias, and a Kill Zone indicator to identify trading opportunities during London and New York sessions.
The strategy follows a simple entry model and avoids excessive complexity. By analyzing fractal highs and lows (*) on the 4-hour chart, traders can determine potential reversals or follow-throughs (*). If a recent fractal high is breached with No Follow-Through, it suggests a reversal, while two successive body candle closes indicates a Strong Follow Through. The 15-minute chart is used for entry, with a focus on selling from premium prices and buying from discount prices (*) during London and New York sessions.
Traders set alerts and wait for the Kill Zone (*) to occur, avoiding constant monitoring. When the conditions align, such as a fractal low sweep during the Kill Zone, a buy stop order is placed with a stop loss at the high or low of the trigger candle and a target of three times the risk taken. Traders let the trade play out without actively managing it.
The strategy offers flexibility for those with full-time jobs, as it only requires attention during specific sessions and eliminates the need for constant chart monitoring. Traders can set alerts and go about their day until a trade setup is triggered. The strategy's simplicity and routine make it suitable for traders looking to optimize their trading process while minimizing emotional decision-making.
(*) The Williams Fractal indicator aims to detect reversal points through highs and lows. It’s known as being one of the first indicators to use fractals and bring it into the trading mainstream. Generally, the indicator is formed by five candlesticks or bars on the price chart and it’s shown with an up or down arrow to signal its high or low status
(*) Non Follow Through - Price wicks through fractal high or low / Price closes above high or low, then closes back in the other direction across the fractal high or low.
(*) Strong Follow Through - Price creates two consecutive candle closes above or below the fractal indicating strong continuation ahead
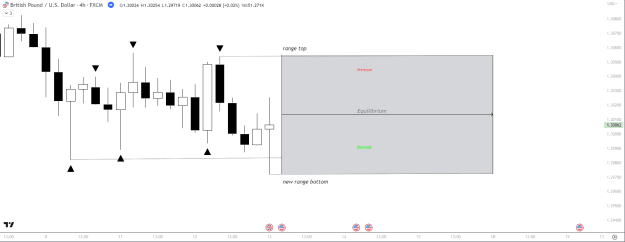
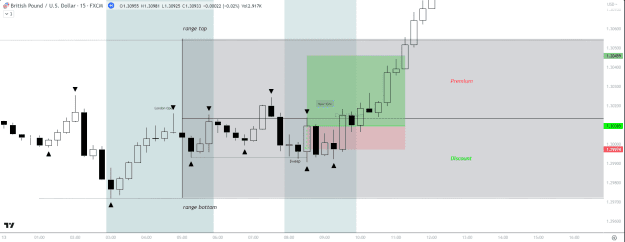
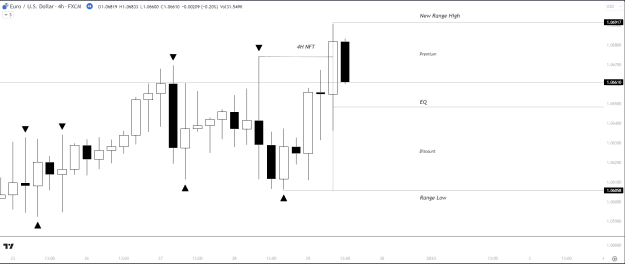
(*) Use a tool on your charting platform, like "Fibonacci Levels" or "Date Range" to measure the total range between the most recent fractal high and low. The middle of this area is considered the "EQ, or Equilibrium". The area above the EQ is considered premium and the area below the EQ is considered discount. Traders will only look for shorts when price is in premium and longs when price is in discount.
(*) Introduced by forex trader Inner Circle Trader, the Killzones represent different time intervals where there is high volatility and coincide with market pre-openings. The Killzones are designed to help traders identify high-probability zones for price action trades in a certain direction, and they have gained popularity among traders.
Simplified NFT Long Example:
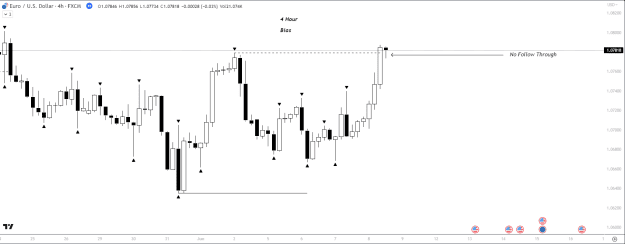
(4H) Wick sweeps recent fractal low creating a Non-Follow Through
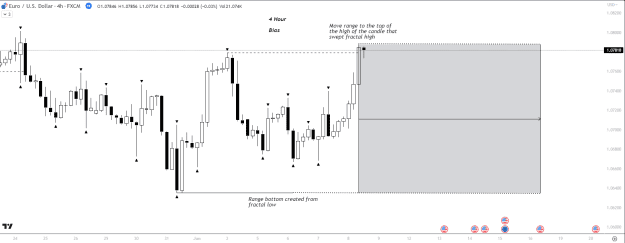
Draw arange from new low and previous recent fractal high
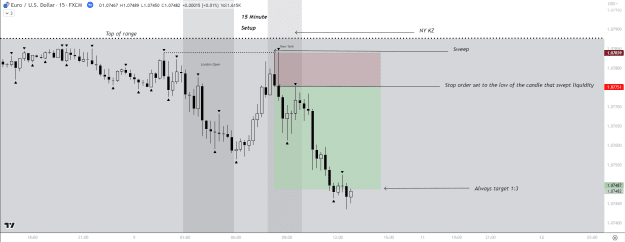
(15M) Wait for price to create a fractal low liquidity sweep, in discount, during NY or London KillZone.
Follow Entry, SL, and TP rules
Simplified SFT Long Example
(H4) Two consecutive bullish candle closes above recent fractal high creating a Strong Follow Through
Draw a range from the new high high and previous recent fractal low
(15M) Wait for price to create a liquidity sweep on the most recent fractal high. Premium/Discount doesn't matter with SFT's.
Follow Entry, SL, and TP rules
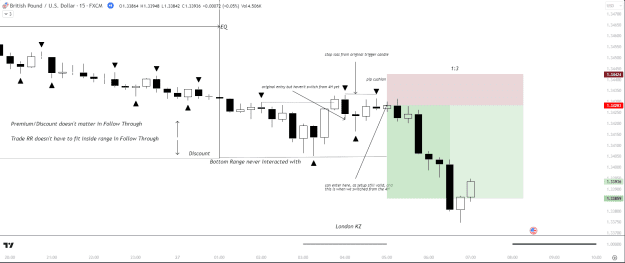
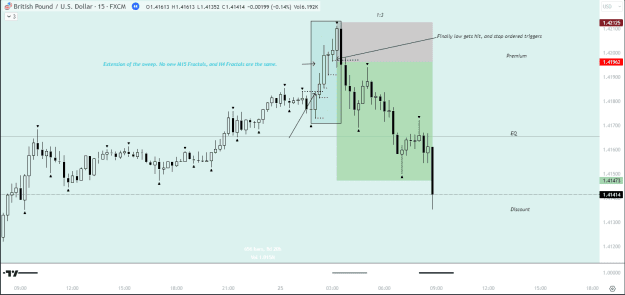
Entry is set to the high of the candle that swept the fractal low.
Stop Loss is set the area of best protection. If there's no good levels around your area of entry you can use the low of the trigger candle with pip cushion instead.
Take profit is 1:3 with stop loss, and on NFT's you must fit the entire 1:3 trade within the range. Strong Follow Through's your full 1:3 trade does not have to fit within the range.
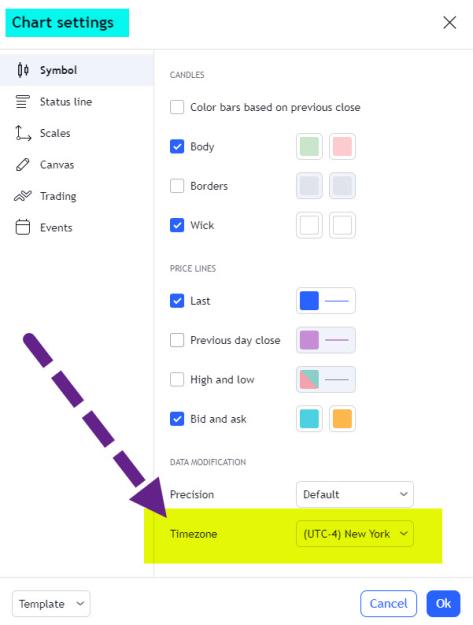
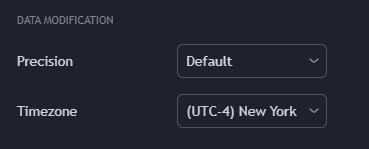
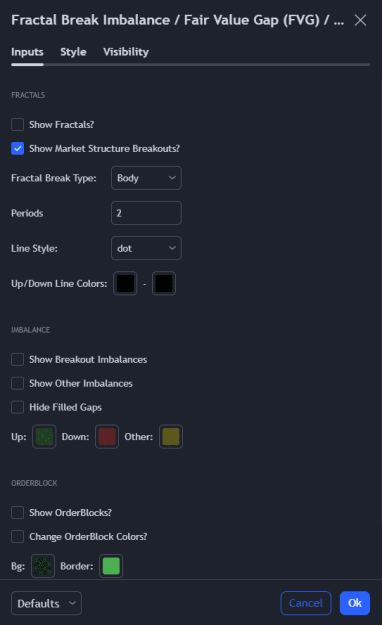
KillZones: Trading Session Indicator - Set it to just show NY and London Sessions. You can manually set the time as well: NY KillZone from 8:00 to 10:00. London KillZone is from 3:00 to 6:00. You can also manually just watch for these times with no indicator.
Williams Fractal:
1. Download and unzip the archive to the MQL4 folder of the terminal;
2. Restart the terminal and run the indicator;
3. Allow import of DLLs.
This Sessions indicator is free and works without any restrictions.
FAQs:
Q:What if I entered a trade and a KillZone ends?
A: Trades are valid as long you enter during NY or London session
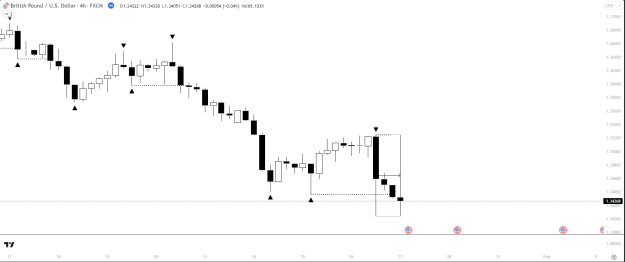
Q:What if price breaches H4 fractal range on the 15 minute setup time frame?
A: When price interacts with the high/low fractal range you can adjust the range. But you should reevaluate and make sure the H4 fractals have not yet changed.
Q: When price breaches fractal high or low, do we draw our range from the new high or low that breached it?
A: Yes, on the 4 Hour bias timeframe, the range will start from the top/bottom of the wick, while the other side of the range remains the same.
TIPS:
Link to timestamped video where trader explains the strategy:
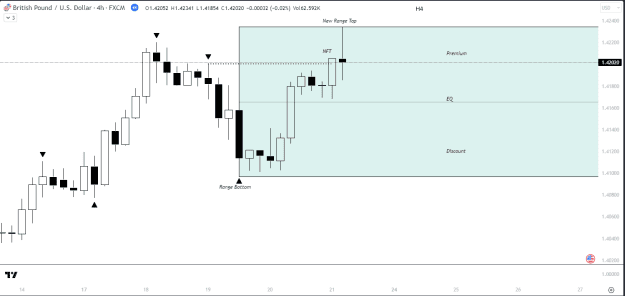
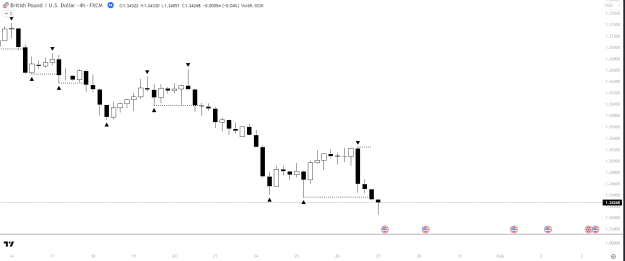
H4 Bias - Price closed above recent fractal high and next bar closed bearish. This creates a NFT to the upside which is a bearish bias.
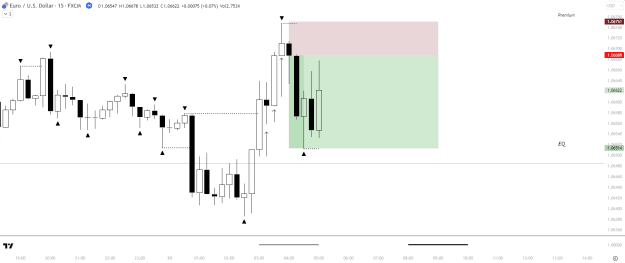
M15 Entry - Price stayed inside of this range for a few days before generating a nice setup. Also shows a sweep extension. Inside premium, inside KZ.
different brokers can generate different fractals. so even though OUR fractals don't align, it doesn't matter. Your trading is based off your broker and chart. SO sometimes we can't compare setups (rare as they're the same most of the time)
IGNORE POST #2 IT’S WRONG
The strategy follows a simple entry model and avoids excessive complexity. By analyzing fractal highs and lows (*) on the 4-hour chart, traders can determine potential reversals or follow-throughs (*). If a recent fractal high is breached with No Follow-Through, it suggests a reversal, while two successive body candle closes indicates a Strong Follow Through. The 15-minute chart is used for entry, with a focus on selling from premium prices and buying from discount prices (*) during London and New York sessions.
Traders set alerts and wait for the Kill Zone (*) to occur, avoiding constant monitoring. When the conditions align, such as a fractal low sweep during the Kill Zone, a buy stop order is placed with a stop loss at the high or low of the trigger candle and a target of three times the risk taken. Traders let the trade play out without actively managing it.
The strategy offers flexibility for those with full-time jobs, as it only requires attention during specific sessions and eliminates the need for constant chart monitoring. Traders can set alerts and go about their day until a trade setup is triggered. The strategy's simplicity and routine make it suitable for traders looking to optimize their trading process while minimizing emotional decision-making.
(*) The Williams Fractal indicator aims to detect reversal points through highs and lows. It’s known as being one of the first indicators to use fractals and bring it into the trading mainstream. Generally, the indicator is formed by five candlesticks or bars on the price chart and it’s shown with an up or down arrow to signal its high or low status
(*) Non Follow Through - Price wicks through fractal high or low / Price closes above high or low, then closes back in the other direction across the fractal high or low.
(*) Strong Follow Through - Price creates two consecutive candle closes above or below the fractal indicating strong continuation ahead
(*) Use a tool on your charting platform, like "Fibonacci Levels" or "Date Range" to measure the total range between the most recent fractal high and low. The middle of this area is considered the "EQ, or Equilibrium". The area above the EQ is considered premium and the area below the EQ is considered discount. Traders will only look for shorts when price is in premium and longs when price is in discount.
(*) Introduced by forex trader Inner Circle Trader, the Killzones represent different time intervals where there is high volatility and coincide with market pre-openings. The Killzones are designed to help traders identify high-probability zones for price action trades in a certain direction, and they have gained popularity among traders.
Simplified NFT Long Example:
(4H) Wick sweeps recent fractal low creating a Non-Follow Through
Draw arange from new low and previous recent fractal high
(15M) Wait for price to create a fractal low liquidity sweep, in discount, during NY or London KillZone.
Follow Entry, SL, and TP rules
Simplified SFT Long Example
(H4) Two consecutive bullish candle closes above recent fractal high creating a Strong Follow Through
Draw a range from the new high high and previous recent fractal low
(15M) Wait for price to create a liquidity sweep on the most recent fractal high. Premium/Discount doesn't matter with SFT's.
Follow Entry, SL, and TP rules
Entry is set to the high of the candle that swept the fractal low.
Stop Loss is set the area of best protection. If there's no good levels around your area of entry you can use the low of the trigger candle with pip cushion instead.
Take profit is 1:3 with stop loss, and on NFT's you must fit the entire 1:3 trade within the range. Strong Follow Through's your full 1:3 trade does not have to fit within the range.
KillZones: Trading Session Indicator - Set it to just show NY and London Sessions. You can manually set the time as well: NY KillZone from 8:00 to 10:00. London KillZone is from 3:00 to 6:00. You can also manually just watch for these times with no indicator.
Attached File(s)
Williams Fractal:
Attached File(s)
1. Download and unzip the archive to the MQL4 folder of the terminal;
2. Restart the terminal and run the indicator;
3. Allow import of DLLs.
This Sessions indicator is free and works without any restrictions.
FAQs:
Q:What if I entered a trade and a KillZone ends?
A: Trades are valid as long you enter during NY or London session
Q:What if price breaches H4 fractal range on the 15 minute setup time frame?
A: When price interacts with the high/low fractal range you can adjust the range. But you should reevaluate and make sure the H4 fractals have not yet changed.
Q: When price breaches fractal high or low, do we draw our range from the new high or low that breached it?
A: Yes, on the 4 Hour bias timeframe, the range will start from the top/bottom of the wick, while the other side of the range remains the same.
TIPS:
Link to timestamped video where trader explains the strategy:
Inserted Video
Attached Image (click to enlarge)
Attached Image (click to enlarge)
M15 Entry - Price stayed inside of this range for a few days before generating a nice setup. Also shows a sweep extension. Inside premium, inside KZ.
different brokers can generate different fractals. so even though OUR fractals don't align, it doesn't matter. Your trading is based off your broker and chart. SO sometimes we can't compare setups (rare as they're the same most of the time)
IGNORE POST #2 IT’S WRONG
Can't go broke making profit