To anyone reading this thread- please comment with any criticism or if you have any suggestions or observations. I actively encourage criticism and don't take it personally. I really appreciate it.
Hi folks,
Returning to the screens after many years off working in the investment industry. My style is based from techniques learnt here such as the threads 'Trendline break (the only system you need)' and 'Psych Levels, Pivots, and Trendlines - Resurrected'
My strategy aims to target the morning breakout at the start of the London/Frankfurt session on the EUR/USD pair. During the prior overnight session a range develops which is usually delineated by a trendline and more often than not also a pattern such as a triangle, flag, wedge etc.
Care is taken to identify support and resistance on higher timeframes as well as on the US Dollar Basket to make sure we are not trading into any major levels.
Entries are taken on the 15m timeframe at the start of a new candle when the trend line is broken with an initial 10 pip stop loss. If a candle closes above (for a short) or below (for a long) then we close the trade for a small loss. If the new candle is more than 5 pips below the trendline we wait for a retrace to achieve a better entry. After 10 pips we move our stop to break even. Profit is taken at major support/resistance levels, and typically we close if 20 pips profit is met. If we take a loss on the first trade, then we'll look for another trendline to develop and wait for that to break. Also, if we are taken out at break even after a retrace to the trendline we can re-enter in the same direction at a touch of the same trendline at a more favourable price.
This system works well from experience but as ever trading psychology is where it can come unstuck, typically chasing losses. As such we will seek to avoid overtrading by stopping all trading for the day if two losses are sustained, and set a weekly target of 50 pips. You also need pretty quick fingers as we can take a loss then very quickly be in a new trade in the opposite direction.
I will post each trade setup at entry, and follow up with all wins and losses. As this is the first day I'll post 'after the fact' commentary on this morning. Comments, criticisms and suggestions are very welcome.
EDIT 16/02/21 - Trading Rules
I wanted to update this thread with some more formal rules. My approach is discretionary based on my reading of the market and a set of well known trading principles. My overarching principle is that you want to be entering and exiting trades where you think the majority of market participants are entering and exiting- this means using the most well known technical principles like support and resistance, etc. We want to get in at extremes of price and reversal points, not after the move has happened. I feel now at I'm at the stage where I'm consistently profitable (I rarely have a losing day now) I can set down how I view the market. The first 5 or 6 pages are mostly guff, really just trying to feel out the markets and relying on my memory of what worked for me about 10 years ago. I was bordering around breakeven, some losing days some winning days. Around January was when it started to become more consistent for me and the pieces started to come together.
THE GOAL: 20 pips a day with minimal drawdown or 2xR
THE PAIRS: I think it's a good idea to focus on one pair initially and maybe add one more pair once you're familiar with your primary pair. As we're scalping pick ones with low spreads. In this case we're primarily looking at EUR/USD and GBP/USD
THE APPROACH: Scalping the 5 min chart, looking for high precision entries with minimal drawdown. Sometimes we'll take scalp entries with swing targets in a few uncommon circimstances. The principle is that we can't know where the market is headed in the long or even medium term, there are too many unpredictable events in the world that can drive the markets so we just want to take small bites out of the market and rely on compounding. We also want to expose ourselves as little as possible to the market- get in and out and don't worry about trades overnight, or trades going into profit and getting 'attached' to them so that we don't close them when they turn on us. My approach is- follow the price. I don't know where the market is going long term but I can predict areas where price might react- where others are likely to cluster their orders and take profits.
THE TOOLS: Supply & Demand, support and resistance, trendlines, pivot points, (some) chart patterns, price action, MACD divergence, multi time frame analysis, fibonacci
MONEY/RISK MANAGEMENT: This is personal, but the usual rules apply. Generally no more than 2% of your account per trade. We want to enter only a small handful of trades per day- the ideal is just one or two. Patience is key waiting for an optimal set up and not taking the first thing you see, losses are to be avoided at all costs as this opens up more gambling type behaviour, loss chasing, tilt etc.
CORRELATION WITH OTHER MARKETS: This is absolutely crucial and the secret sauce for this approach. We'll only be trading dollar cross pairs so we will always be aware of what's happening on DXY (US dollar basket), usually only entering certain types of trades when we have backup on DXY (ie a S&R area).
GOLDEN RULE: BE PATIENT! Only take a set up if it screams out at you. Just wait if it's ambiguous. A losing trade makes your job twice as hard. Aggressively protect your capital and put your stops at breakeven quickly.
Next will be the chart setup and the 5 or 6 types of trades we enter
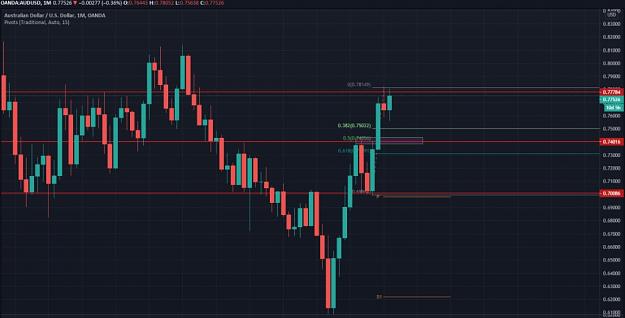
THE CHART SETUP - AUD/USD
I picked a fresh chart to draw out the important areas. We'll start on the monthly and work our way down to the 5 minute. First up go into the monthly chart and draw horizontal lines to mark out obvious support and resistance areas, mark them with a red thick solid line. Then use the fibonacci retracement tool and draw a fib from the most recent swing high and low. Think about if the market is trending, if we are in an impulse phase or retracement phase. In this case, it looks like we are in a bullish market, we've made a high, and this month we have tested this high and can expect a retrace to test the last resistance turned support. In this case 0.7405, support/0.5 retrace looks like a good potential if ambitious short target.
Indicators: MACD (standard settings) and pivot points standard
Weekly Chart: https://www.forexfactory.com/thread/...4#post13412204
Daily Chart: https://www.forexfactory.com/thread/...5#post13412215
4 Hour Chart: https://www.forexfactory.com/thread/...9#post13412239
15 minute chart: https://www.forexfactory.com/thread/...6#post13412256
The Setups
Wedge Break and Retest: https://www.forexfactory.com/thread/...5#post13412265
Wedge Upper Edge/Confluence: https://www.forexfactory.com/thread/...6#post13370016
Pivot Bounce Trade: https://www.forexfactory.com/thread/...6#post13412276
Confluence Scalp: https://www.forexfactory.com/thread/...9#post13412289
The 'M' and 'W' Pattern: https://www.forexfactory.com/thread/...2#post13412312
Flag Break and Retest: https://www.forexfactory.com/thread/...4#post13412324
Hi folks,
Returning to the screens after many years off working in the investment industry. My style is based from techniques learnt here such as the threads 'Trendline break (the only system you need)' and 'Psych Levels, Pivots, and Trendlines - Resurrected'
My strategy aims to target the morning breakout at the start of the London/Frankfurt session on the EUR/USD pair. During the prior overnight session a range develops which is usually delineated by a trendline and more often than not also a pattern such as a triangle, flag, wedge etc.
Care is taken to identify support and resistance on higher timeframes as well as on the US Dollar Basket to make sure we are not trading into any major levels.
Entries are taken on the 15m timeframe at the start of a new candle when the trend line is broken with an initial 10 pip stop loss. If a candle closes above (for a short) or below (for a long) then we close the trade for a small loss. If the new candle is more than 5 pips below the trendline we wait for a retrace to achieve a better entry. After 10 pips we move our stop to break even. Profit is taken at major support/resistance levels, and typically we close if 20 pips profit is met. If we take a loss on the first trade, then we'll look for another trendline to develop and wait for that to break. Also, if we are taken out at break even after a retrace to the trendline we can re-enter in the same direction at a touch of the same trendline at a more favourable price.
This system works well from experience but as ever trading psychology is where it can come unstuck, typically chasing losses. As such we will seek to avoid overtrading by stopping all trading for the day if two losses are sustained, and set a weekly target of 50 pips. You also need pretty quick fingers as we can take a loss then very quickly be in a new trade in the opposite direction.
I will post each trade setup at entry, and follow up with all wins and losses. As this is the first day I'll post 'after the fact' commentary on this morning. Comments, criticisms and suggestions are very welcome.
EDIT 16/02/21 - Trading Rules
I wanted to update this thread with some more formal rules. My approach is discretionary based on my reading of the market and a set of well known trading principles. My overarching principle is that you want to be entering and exiting trades where you think the majority of market participants are entering and exiting- this means using the most well known technical principles like support and resistance, etc. We want to get in at extremes of price and reversal points, not after the move has happened. I feel now at I'm at the stage where I'm consistently profitable (I rarely have a losing day now) I can set down how I view the market. The first 5 or 6 pages are mostly guff, really just trying to feel out the markets and relying on my memory of what worked for me about 10 years ago. I was bordering around breakeven, some losing days some winning days. Around January was when it started to become more consistent for me and the pieces started to come together.
THE GOAL: 20 pips a day with minimal drawdown or 2xR
THE PAIRS: I think it's a good idea to focus on one pair initially and maybe add one more pair once you're familiar with your primary pair. As we're scalping pick ones with low spreads. In this case we're primarily looking at EUR/USD and GBP/USD
THE APPROACH: Scalping the 5 min chart, looking for high precision entries with minimal drawdown. Sometimes we'll take scalp entries with swing targets in a few uncommon circimstances. The principle is that we can't know where the market is headed in the long or even medium term, there are too many unpredictable events in the world that can drive the markets so we just want to take small bites out of the market and rely on compounding. We also want to expose ourselves as little as possible to the market- get in and out and don't worry about trades overnight, or trades going into profit and getting 'attached' to them so that we don't close them when they turn on us. My approach is- follow the price. I don't know where the market is going long term but I can predict areas where price might react- where others are likely to cluster their orders and take profits.
THE TOOLS: Supply & Demand, support and resistance, trendlines, pivot points, (some) chart patterns, price action, MACD divergence, multi time frame analysis, fibonacci
MONEY/RISK MANAGEMENT: This is personal, but the usual rules apply. Generally no more than 2% of your account per trade. We want to enter only a small handful of trades per day- the ideal is just one or two. Patience is key waiting for an optimal set up and not taking the first thing you see, losses are to be avoided at all costs as this opens up more gambling type behaviour, loss chasing, tilt etc.
CORRELATION WITH OTHER MARKETS: This is absolutely crucial and the secret sauce for this approach. We'll only be trading dollar cross pairs so we will always be aware of what's happening on DXY (US dollar basket), usually only entering certain types of trades when we have backup on DXY (ie a S&R area).
GOLDEN RULE: BE PATIENT! Only take a set up if it screams out at you. Just wait if it's ambiguous. A losing trade makes your job twice as hard. Aggressively protect your capital and put your stops at breakeven quickly.
Next will be the chart setup and the 5 or 6 types of trades we enter
THE CHART SETUP - AUD/USD
I picked a fresh chart to draw out the important areas. We'll start on the monthly and work our way down to the 5 minute. First up go into the monthly chart and draw horizontal lines to mark out obvious support and resistance areas, mark them with a red thick solid line. Then use the fibonacci retracement tool and draw a fib from the most recent swing high and low. Think about if the market is trending, if we are in an impulse phase or retracement phase. In this case, it looks like we are in a bullish market, we've made a high, and this month we have tested this high and can expect a retrace to test the last resistance turned support. In this case 0.7405, support/0.5 retrace looks like a good potential if ambitious short target.
Indicators: MACD (standard settings) and pivot points standard
Weekly Chart: https://www.forexfactory.com/thread/...4#post13412204
Daily Chart: https://www.forexfactory.com/thread/...5#post13412215
4 Hour Chart: https://www.forexfactory.com/thread/...9#post13412239
15 minute chart: https://www.forexfactory.com/thread/...6#post13412256
The Setups
Wedge Break and Retest: https://www.forexfactory.com/thread/...5#post13412265
Wedge Upper Edge/Confluence: https://www.forexfactory.com/thread/...6#post13370016
Pivot Bounce Trade: https://www.forexfactory.com/thread/...6#post13412276
Confluence Scalp: https://www.forexfactory.com/thread/...9#post13412289
The 'M' and 'W' Pattern: https://www.forexfactory.com/thread/...2#post13412312
Flag Break and Retest: https://www.forexfactory.com/thread/...4#post13412324
Attached Image (click to enlarge)