Introduction to this thread;
I can't recommend any substitute for experience gained by a large amount of practise. By practising one particular system and keeping a journal of your trading progress, you combine 2 things that the infamous 95% most likely doesn’t.
Only strong motivation and a clear visualization of my (hopefully soon upcoming) future have made me survive in this particular learning-hell, for that is what forex have given me. And I will not be too surprised if that [will be/is your] experience.
“Opinions based on fundamentals shouldn't be called "analyses". Especially in the long run since fundamentals do change over time while technicals just continue to perform in accordance with its pre-installed programs. Therefore analysing current fundamentals for developing longer-term projections, just makes no sense at all” by Igrok.
_ _ _ _ _ _ _ _ _ _ _ _ _ _ _ _ _ _ _ _ _ _ _ _ _ _ _ _ _ _ _ _ _ _ _ _ _ _ _ _ _ _
“When forecasting the future, all you need to do is recognize that there is about to be an inequality in supply and demand”
Technical analyses can only present scenarios of (increased) probabilities
With the right amount of practice, research and testing (along with a focused mind), your brain will most likely (after some years depending on your intelligence I would assume) start to recognize different patterns on your chart very well, just with different modifications, time after time.
The main-focus of this thread is to put a exercise-plan (system) for the methods named in the threads topic which you can practice on yourself.
Contain of this thread presented in posted orders;
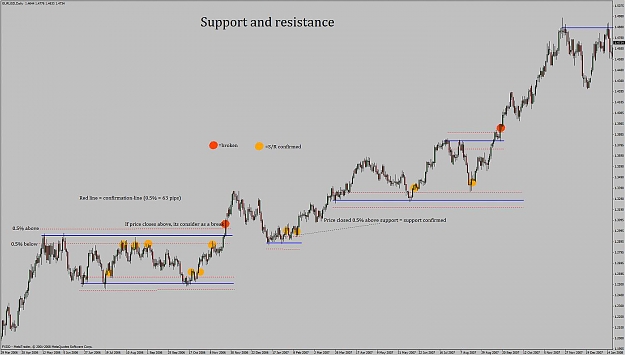
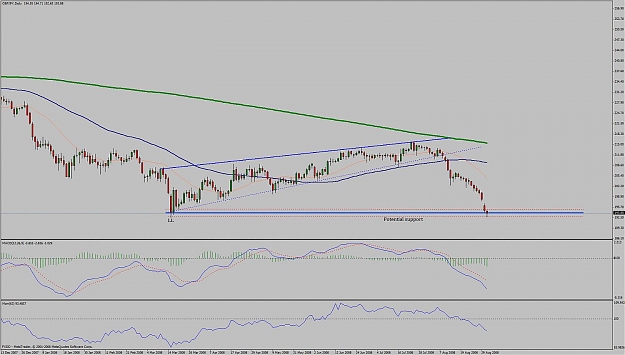
- Applying support and resistance, but never without the word potential.
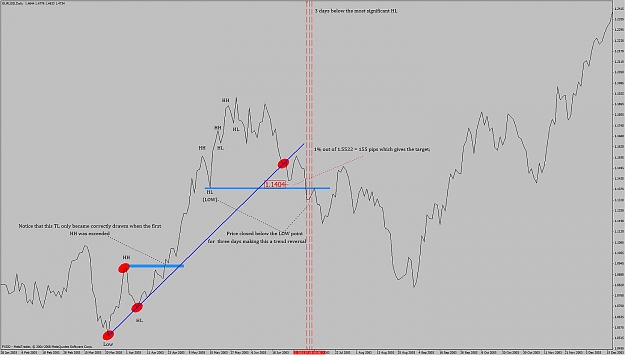
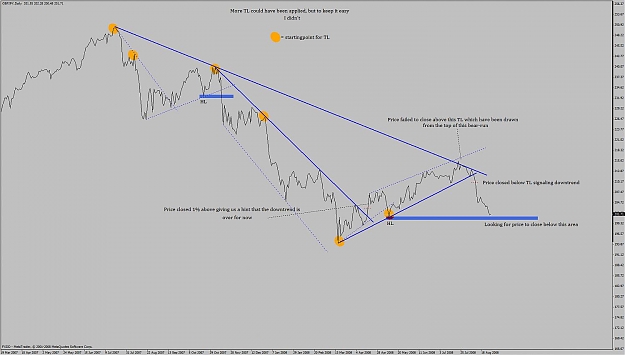
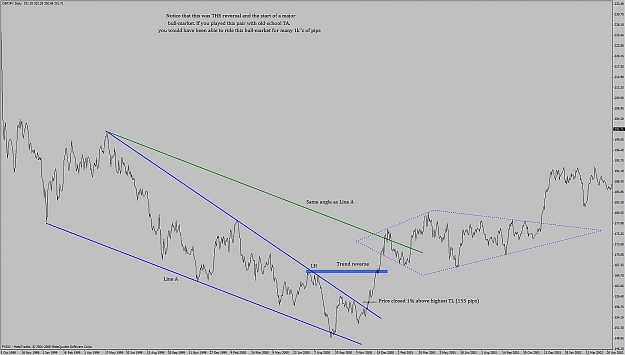
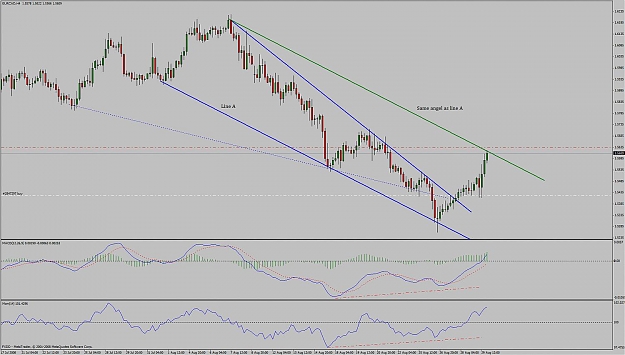
- How to draw trend-lines in an efficient way. This is a method I've never seen around before, and credit is given to Brian Marber for putting my "last" pieces of this puzzle together with the help of he's book.
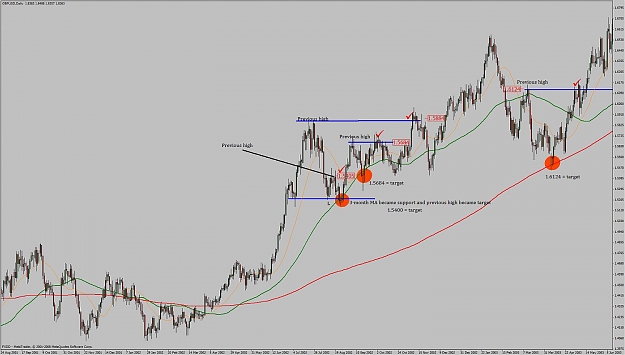
- Correct use of moving averages (1-month, 3-month and 1-year). I mostly use them as potential support and resistance and a reminder of what way the price is channelling, if my head is not on.
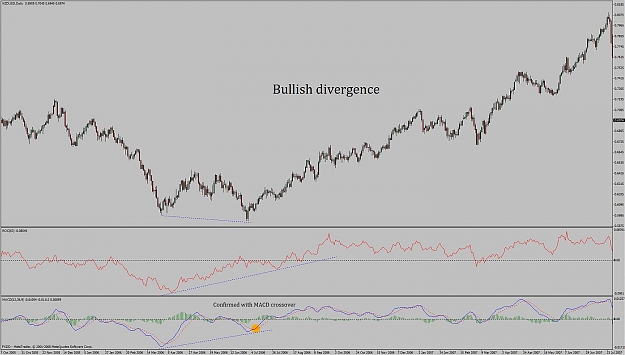
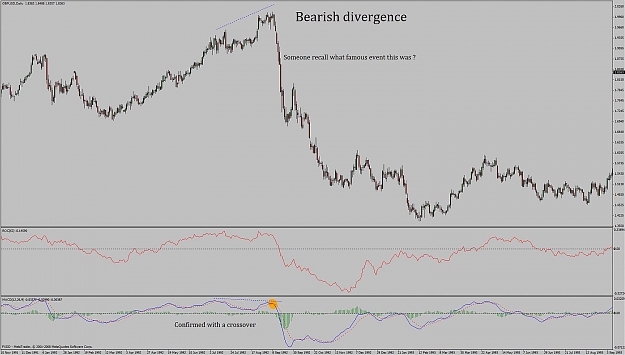
- How to use indicators (mostly ROC and MACD) correctly with divergence as the key-word.
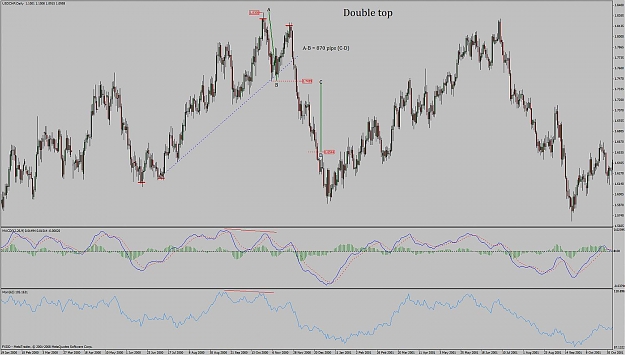
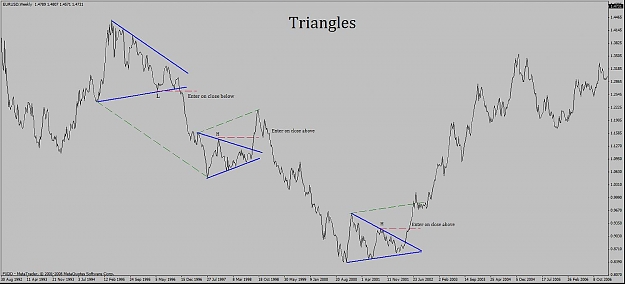
- How to practice on different price-patterns like head and shoulders, double top/bottoms, triangles, flags (and even diamonds thanks to Igrok which happen to have the only efficient way of applying diamonds seen so far by me).
Examples of candlestick (more known as price-action here @ FF) might be presented during time on this thread, hand in hand with rest of the threads concept depending on how it develops. I will edit post #1 if so happen with details. During my different researches, I’ve seen how good entries/exit candlestick (pinbars on trend-lines, inner-bar after long bear/bull runs to mention a few) can give from time to time along with trend-lines and price-patterns.
The recommended time-frame for any instance mentioned, if nothing else is said, is daily. Don’t apply this on a 1h chart, please.
Charts posted in this thread have education purpose only. Don't take any of the potential setups presented in the future as trading-signals ! Trading of daily -> charts will in most cases present hundreds of pips in SL, which never should exceed above 0.5-2% of your entire account.