
Advertisement
Advertisement
Bitcoin Price Forecast: Bullish Momentum Builds
By:
Bitcoin's recent bullish breakouts and confirmation of strength indicate potential for a continued advance. Despite a possible pullback, the outlook remains positive, with new record highs on the horizon.
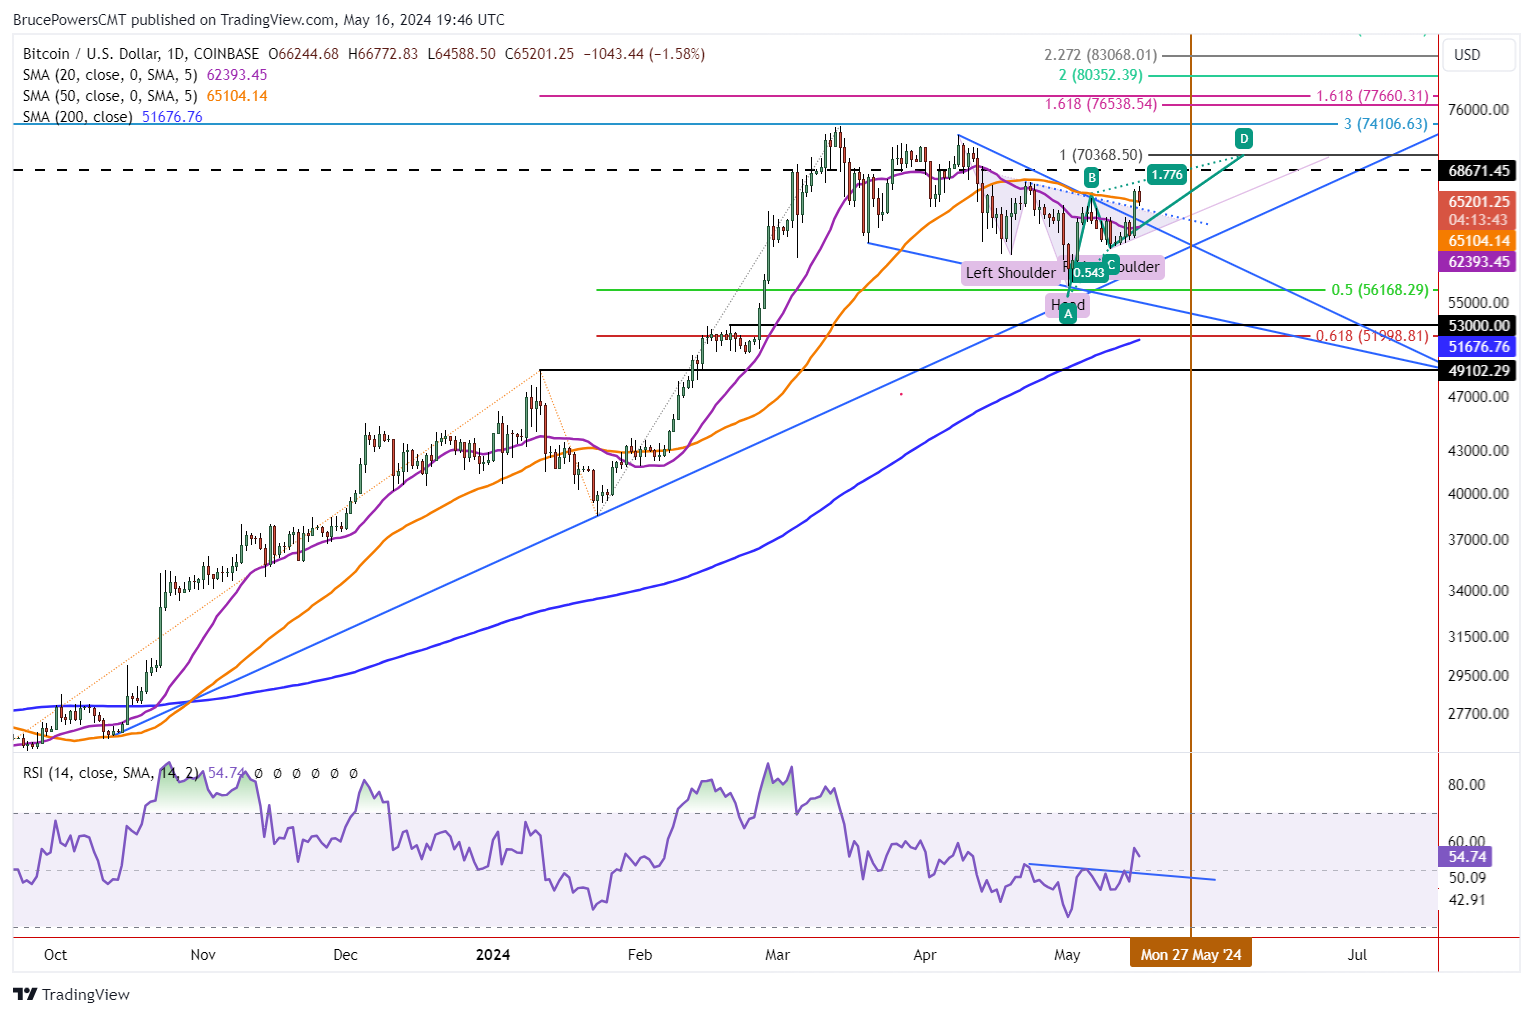
Bitcoin triggered several bullish breakouts on Wednesday as it exceeded a downtrend line, the 50-Day MA, and advanced out of a head and shoulders pattern. Further, yesterday’s close was above all breakout levels thereby confirming strength of the advance.
Today is a rest day with Bitcoin trading in a relatively narrow range and successfully test the neckline of the head and shoulders pattern as support (light dotted blue). Once resistance is exceeded to the upside and then tested as support, the advance is cleared to continue to strengthen. A daily close today above the 50-Day line at 65,107 will provide an additional sign of strength.
Further Tests of Support Would be Normal
Nevertheless, a pullback to test support of the downtrend line may still occur. That would not change the improving bullish outlook in Bitcoin as it would be normal to test prior resistance as support. However, a decline to below 61,300 is a deeper pullback that will raise concerns about its ability to continue to strengthen in the near term.
Advance Above 66,773 Gives Bullish Signal
A decisive rally above today’s high of 66,773 triggers a bullish continuation of the advance. There will then be two initial price levels to watch for possible resistance. The first is around 68,671 as it was the prior record high from November 2021. Bitcoin should plow right through it as it did initially in early-March of this year.
It will be the second time that a breakout above the 68,671-price level was attempted. And therefore, it should have greater success, first testing the recent record high of 73,836, and then proceeding to new record highs. Nonetheless, there is an interim price target at 70,368/69. That is the completion of an initial target for a small rising ABCD pattern, as shown on the chart.
Strength Also Seen in Weekly Chart
Also, strength can be seen recently in the weekly chart (not shown). Two weeks ago, Bitcoin hit a retracement low and completed a potentially bullish hammer candlestick pattern. A bullish breakout was triggered last week but the advance quickly stalled. Instead, this week the upside continuation occurs with Bitcoin now on track to end the week possibly at a four or five-week closing high. If that happens, it will be well on its way to approaching new trend highs.
For a look at all of today’s economic events, check out our economic calendar.
About the Author
Bruce Powersauthor
Bruce boasts over 20 years in financial markets, holding senior roles such as Head of Trading Strategy at Relentless 13 Capital and Corporate Advisor at Chronos Futures. A CMT® charter holder and MBA in Finance, he's a renowned analyst and media figure, appearing on 150+ TV business shows.
Did you find this article useful?
Latest news and analysis


Advertisement