
Advertisement
Advertisement
Bitcoin (BTC) News Today: Analyzing BTC’s Reaction to US Inflation and Powell
By:
Key Points:
- Bitcoin (BTC) advanced by 2.33% on Monday (May 13), ending the session at $62,920.
- Buyer demand for BTC returned as investors consider the upcoming US inflation numbers, the Fed Chair Powell speech, and BTC-spot ETF market flow trends.
- On Tuesday (May 14), US producer prices, Fed Chair Powell, and US BTC-spot ETF market flow data need consideration.

In this article:
Fed Rate Cut Hopes Drive Buyer Demand for BTC
Bitcoin (BTC) gained 2.33% on Monday (May 13). Following a 1.00% rise on Sunday (May 12), BTC ended the session at $62,920.
Investors brushed aside Hong Kong BTC-spot market flow data for Monday. According to Farside Investors, the HK BTC-spot ETF market faces a third consecutive day of net outflows. Based on flow data from AMC, the ChinaAMC Bitcoin ETF saw net outflows of $15.5 million on Monday (May 13). Numbers for Harvest and Bosera were pending.
Hopes of a September Fed rate cut lingered despite uptrends in US consumer inflation expectations.
According to the CME FedWatch Tool, the chances of the Fed leaving interest rates unchanged in September stood at 38.8%, unchanged from Friday (May 10). The numbers aligned with a Reuters Poll that showed a majority of economists expecting a September Fed rate cut. 70 of 108 economists reportedly predicted a September Fed rate cut.
US BTC-Spot ETF Market Inflows Hinged on IBIT
The US BTC-spot ETF market reflected the expectations of a Fed rate cut.
According to Farside Investors,
- Grayscale Bitcoin Trust (GBTC) saw zero net flows on Monday (May 13).
- Fidelity Wise Origin Bitcoin Fund (FBTC) reported net inflows of $38.6 million.
- Bitwise Bitcoin ETF (BITB) saw net inflows of $20.3 million, with VanEck Bitcoin Trust (HODL) reporting net inflows of $7.1 million.
- Excluding flow data for iShares Bitcoin Trust (IBIT), the BTC-spot ETF market saw total net inflows of $66.0 million.
- A total of seven issuers saw zero net flows on Monday (May 13).
US producer prices and Fed Chair Powell could influence investor sentiment toward the Fed rate path on Tuesday (May 14).
Economists forecast producer prices to increase 2.2% year-on-year in April after rising 2.1% in March. Hotter-than-expected numbers and a hawkish Fed Chair could sink investor bets on a September rate cut. However, the US CPI Report will likely impact the Fed rate path more. The US CPI Report will be in focus on Wednesday (May 15).
Falling bets on a September Fed rate cut may impact buyer demand for BTC-spot ETFs and BTC price trends.
Technical Analysis
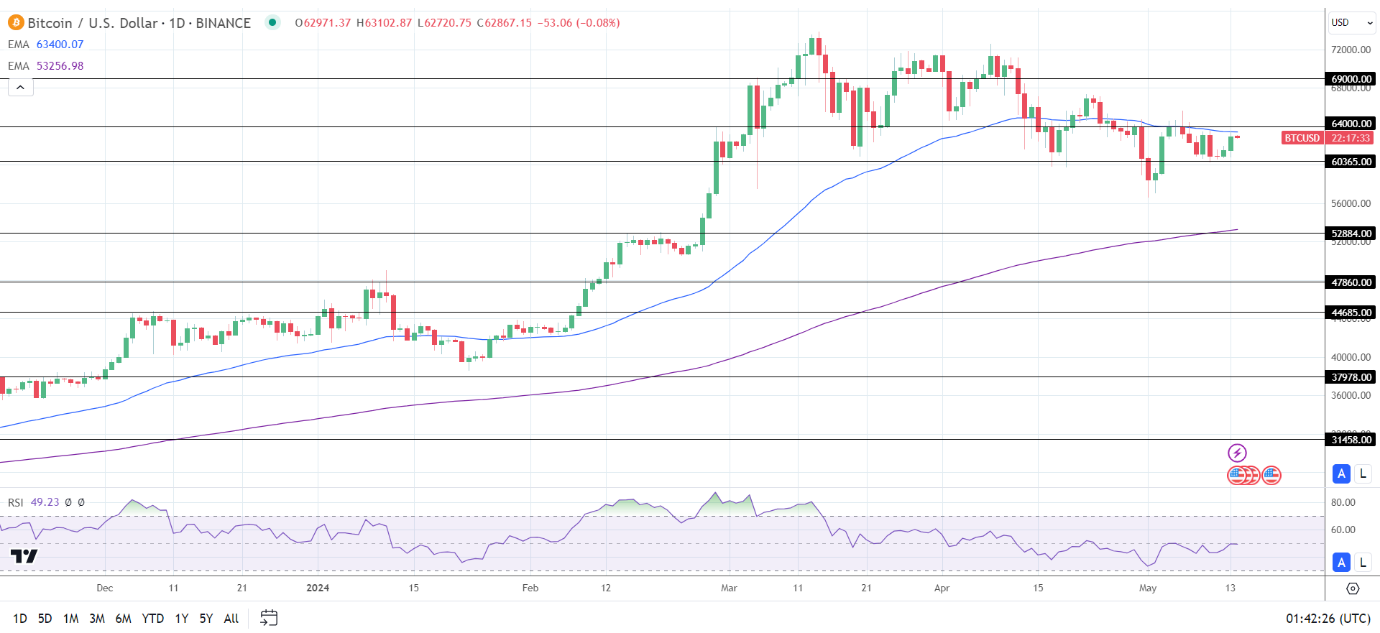
Bitcoin Analysis
BTC hovered below the 50-day EMA while remaining above the 200-day EMA. The EMAs confirmed the bearish near-term but bullish longer-term price trends.
A BTC breakout from the 50-day EMA and the $64,000 resistance level would give the bulls a run at the $69,000 resistance level. A BTC break above the $69,000 resistance level could support a move toward the $73,808 all-time high.
US producer prices, Fed Chair Powell, and US BTC-spot ETF flow trends need consideration.
Conversely, a BTC drop below the $60,365 support level could give the bears a run at the $58,000 handle.
With a 49.23 14-Daily RSI reading, BTC could fall through the $58,000 handle before entering oversold territory.
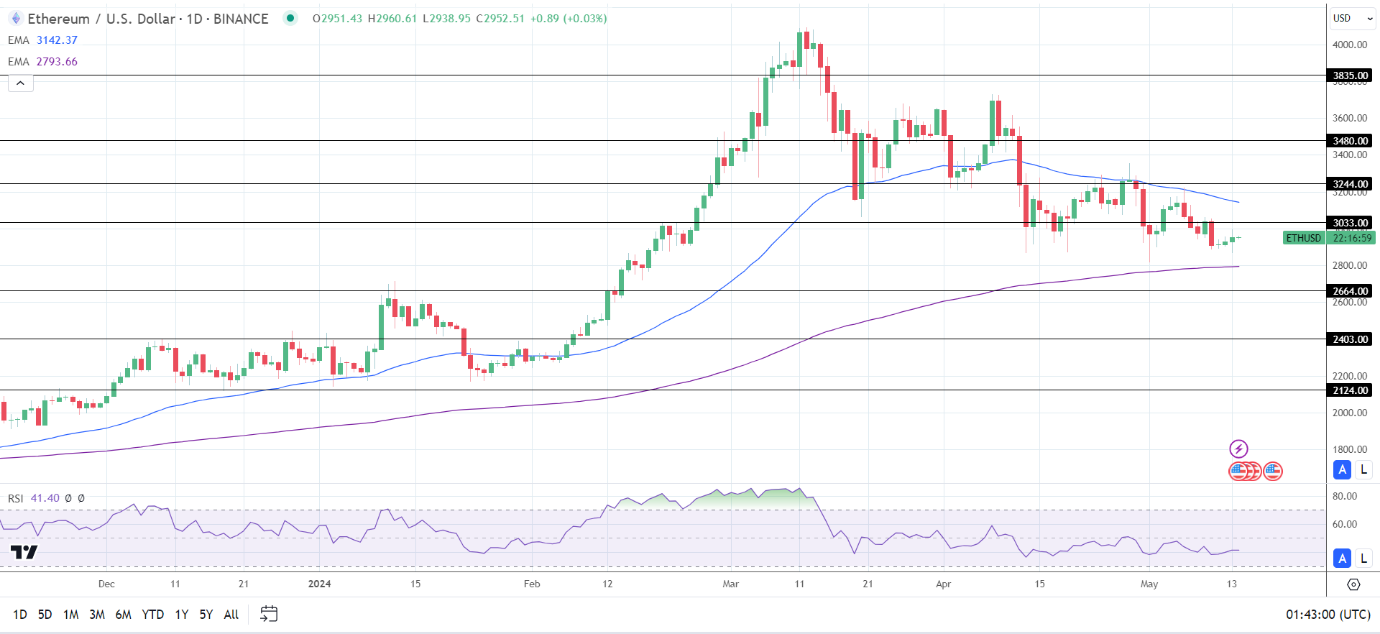
Ethereum Analysis
ETH remained below the 50-day EMA while holding above the 200-day EMA. The EMAs confirmed the bearish near-term but bullish longer-term price trends.
An ETH move above the $3,033 resistance level would bring the 50-day EMA into play. A break above the 50-day EMA would support a move toward the $3,244 resistance level.
Conversely, an ETH fall through the 200-day EMA could give the bears a run at the $2,664 support level.
The 14-period Daily RSI reading of 41.40 indicates an ETH break below the 200-day EMA before entering oversold territory.
About the Author
Bob Masonauthor
With over 20 years of experience in the finance industry, Bob has been managing regional teams across Europe and Asia and focusing on analytics across both corporate and financial institutions. Currently he is covering developments relating to the financial markets, including currencies, commodities, alternative asset classes, and global equities.
Did you find this article useful?
Latest news and analysis


Advertisement