
Advertisement
Advertisement
Bitcoin Price Forecast: Sellers Back in Charge
By:
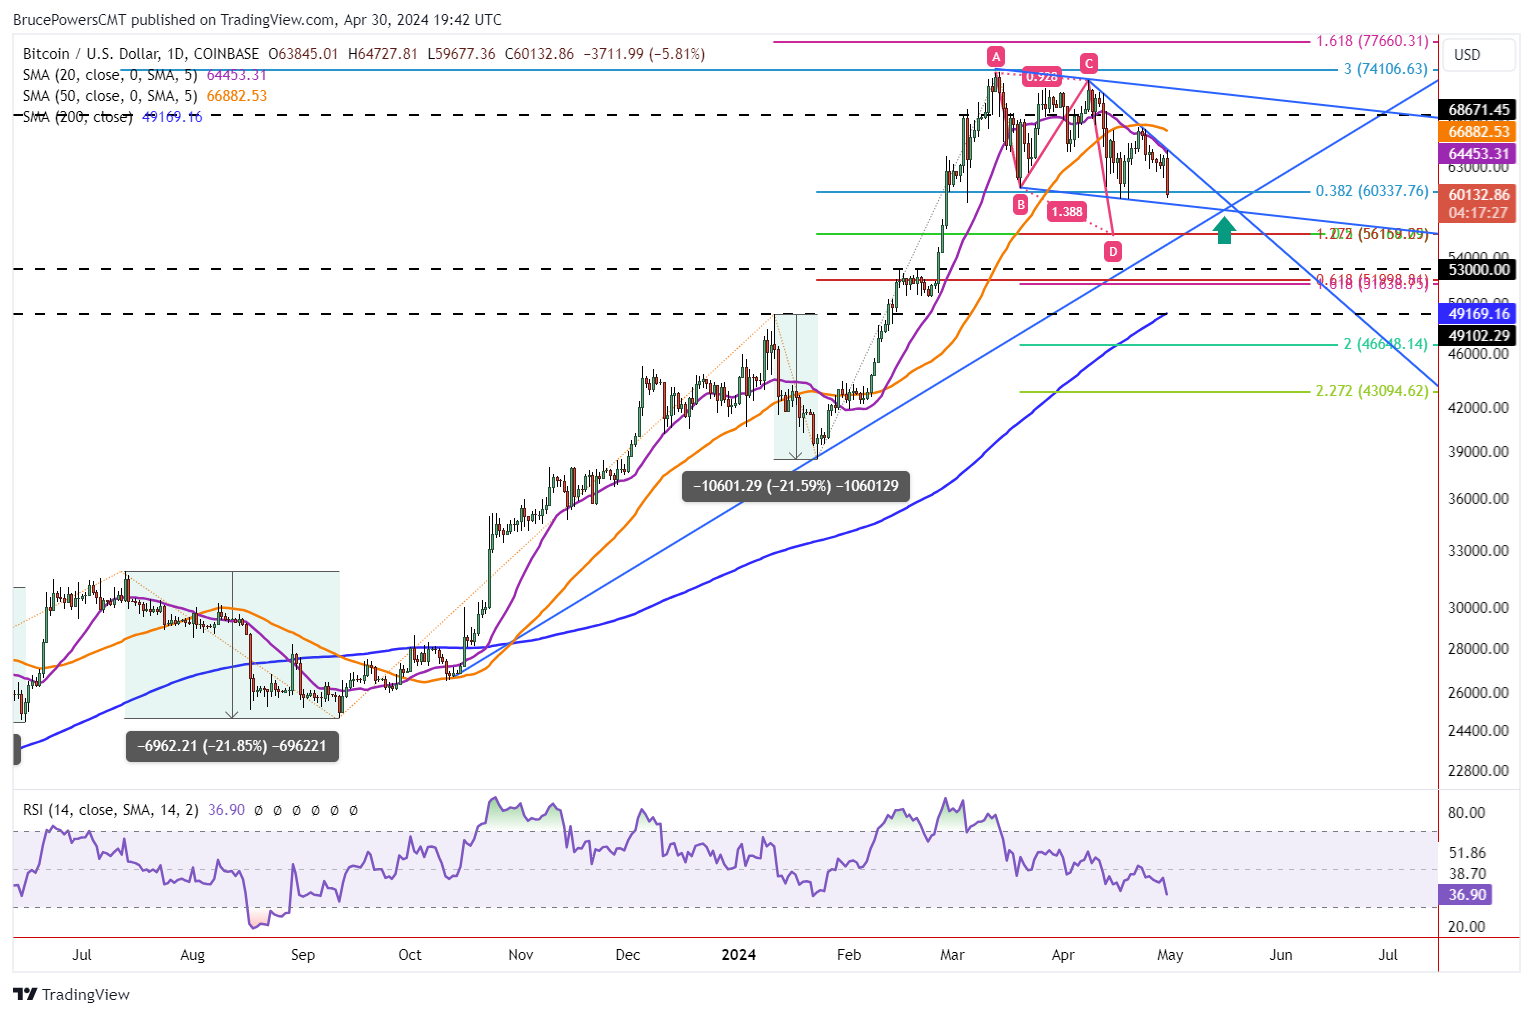
Bitcoin is consolidating and testing key moving average resistances, with more bearish signs emerging. Support levels around 59,573 and 56,159 are crucial as a bearish scenario dominates for now.
Following the April 13 decline in Bitcoin, it has been consolidating and testing resistance of the orange 50-Day MA and purple 20-Day MAs. It did so again today, Tuesday, with a high of 64,728 before sellers took back control and dropped it sharply. Prior support around 59,573 looks to be the next target, followed by a test of support at the lower trendline across the bottom of recent consolidating price action. Although bearish signs are becoming more prominent, there is a chance that line stops the decline and remains support for some time.
Bullish Scenario: Bull Wedge, Bull Flag
The bullish scenario includes a potential bull wedge pattern within a large bull flag consolidation pattern. Each is a trend continuation pattern where the expected resolution is most likely to the upside. However, that is only correct once the pattern has confirmed by an upside breakout. Of course, that has not happened yet. Therefore, downside risk remains. As it stands now, the bearish case would dominate unless there is a decisive rally above 67,226.
Bearish Signs Dominate
There are bearish signs that continue to confirm. Today for example, as noted above, Bitcoin was solidly rejected from resistance around the 20-Day MA. Selling subsequently intensified, with Bitcoin continuing to trade near the lows of the day, at the time of this writing. Bitcoin triggered a breakdown on the weekly chart recently on a drop below 62,389 and is now accelerating a decline.
Moreover, the shorter 20-Day MA crossed below the longer 50-Day MA on April 18, and the relationship with price has shown prior moving average support now acting as resistance. As the price of Bitcoin moves lower and away from the 20-Day line, the possibility for accelerated selling increases. And we’re starting to see that today.
First Lower Target is 56,159
If the bear wedge continues to evolve and the price of Bitcoin remains within the parameters of the pattern, there is a possibility of an eventual upside breakout. But if the lower boundary line (approximately 59,101) is broken to the downside lower price zones become targets. The first key identified lower target is around 56,159, consisting of a 50% retracement level and the completion of a falling ABCD pattern. If Bitcoin keeps falling from there, the prior trend high of 53,000 becomes a target, and down to 51,639.
For a look at all of today’s economic events, check out our economic calendar.
About the Author
Bruce Powersauthor
Bruce boasts over 20 years in financial markets, holding senior roles such as Head of Trading Strategy at Relentless 13 Capital and Corporate Advisor at Chronos Futures. A CMT® charter holder and MBA in Finance, he's a renowned analyst and media figure, appearing on 150+ TV business shows.
Did you find this article useful?
Latest news and analysis


Advertisement