While bears did indeed make an appearance last week and snap an eight-week winning streak, BTC/USD remains on track to record a third consecutive month in the green (MTD performance: +11.6%). In a market demonstrating uptrends on both the weekly and daily timeframes, the recent surge witnessed the major cryptocurrency reach $45,000, levels not seen since April 2022.
Weekly resistance ahead
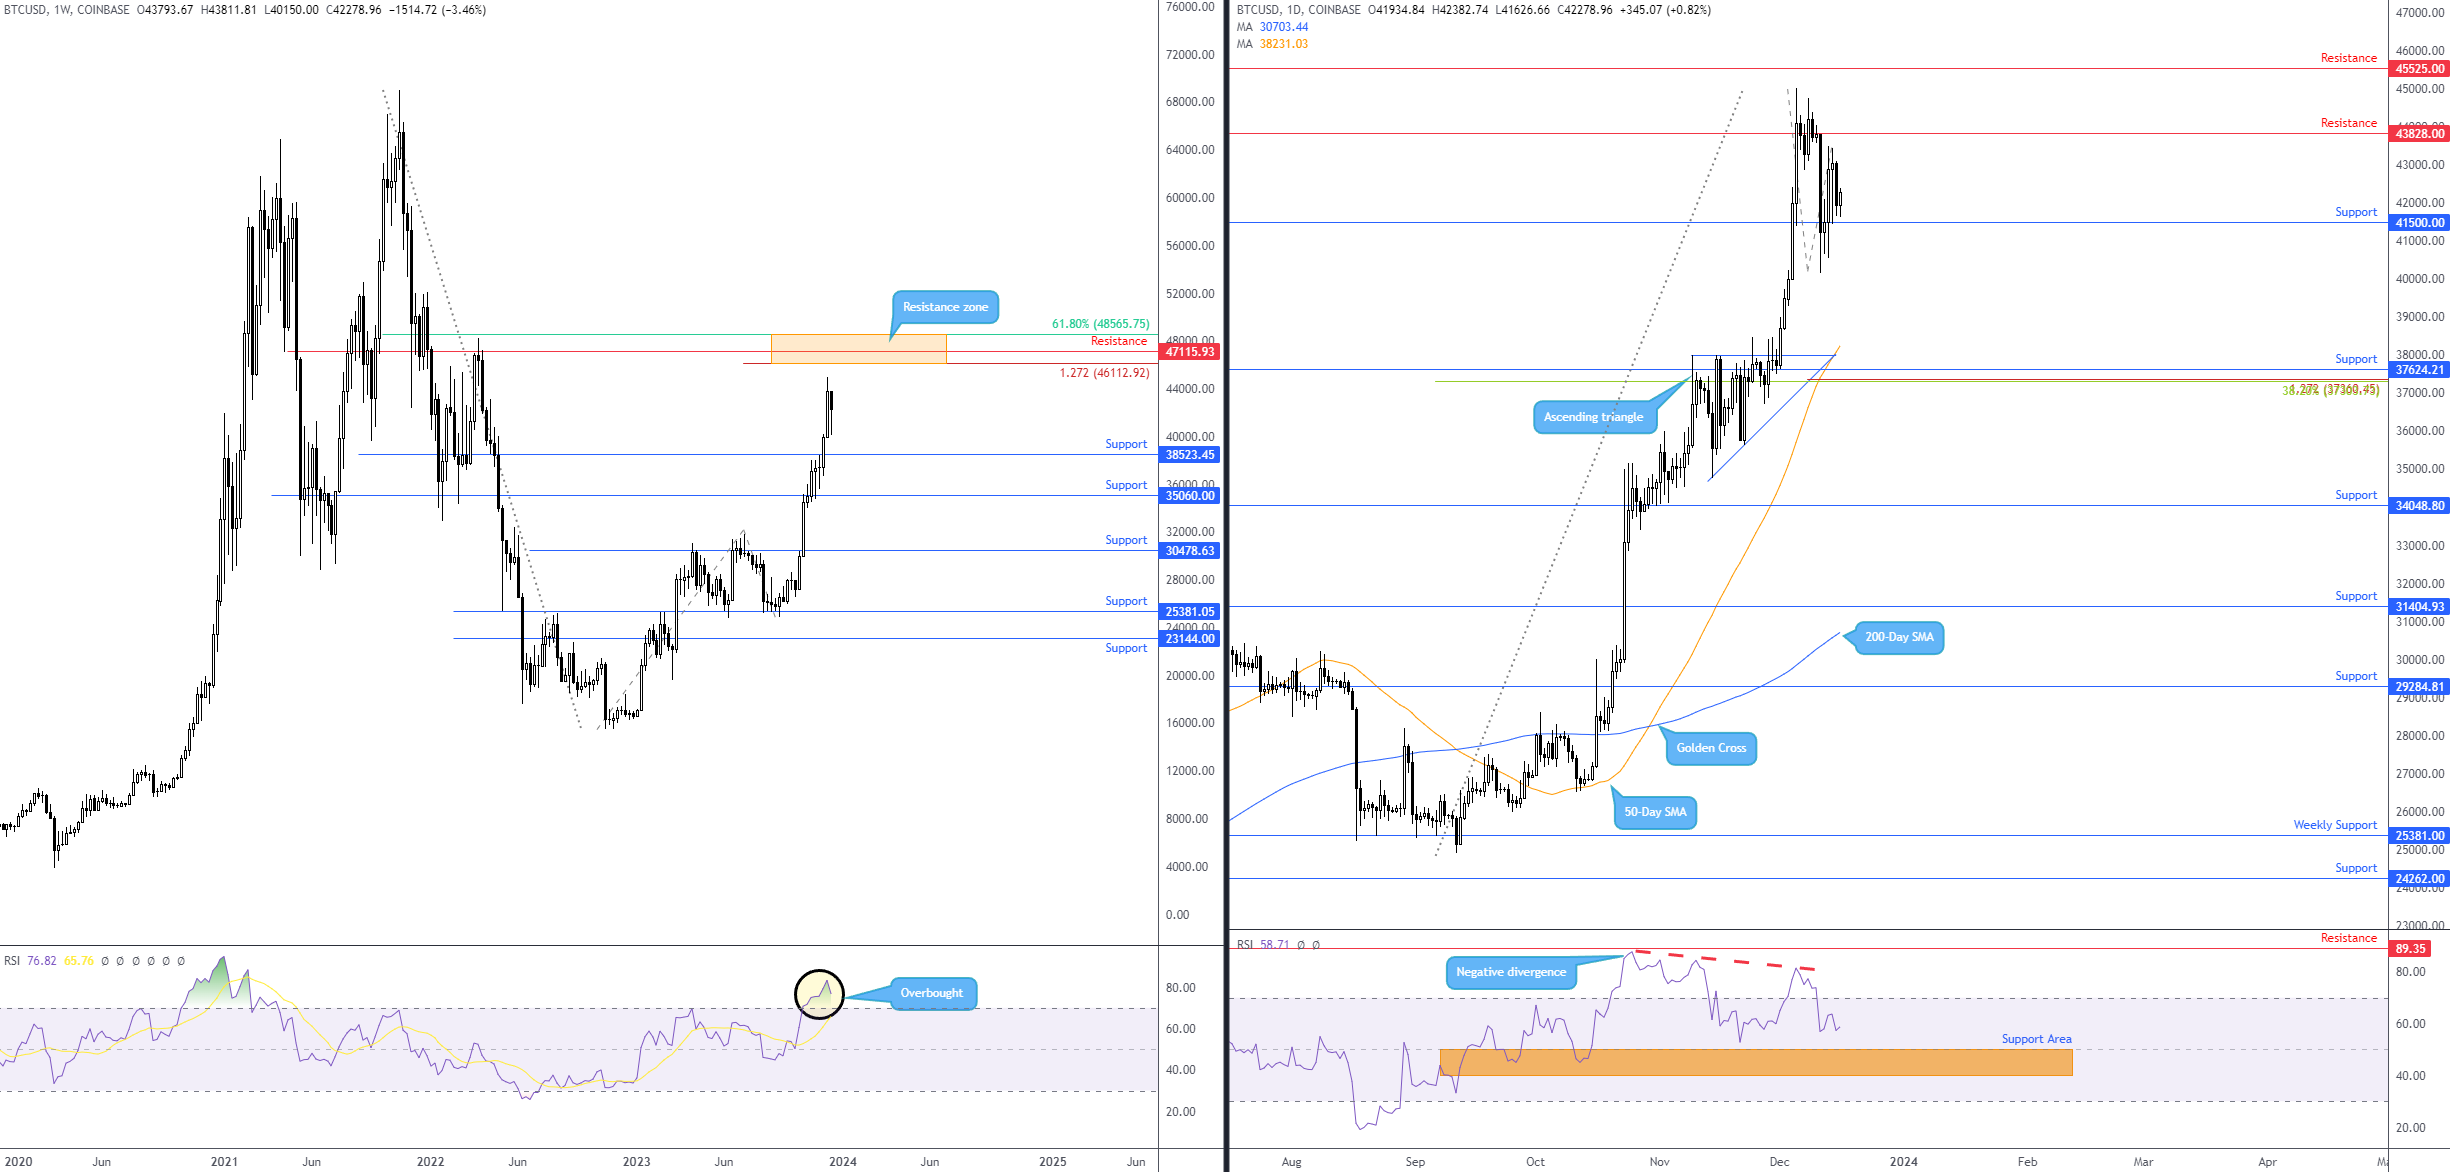
As aired in last week’s week ahead post, the biggest technical challenge for BTC/USD bulls remains the resistance zone between $48,565 and $46,112, comprises a horizontal base, a 1.272% Fibonacci projection ratio (an ‘alternate’ AB=CD bearish pattern) and a 61.8% Fibonacci retracement ratio. The Research Team also directed the technical spotlight to the Relative Strength Index (RSI), seen testing overbought levels (highest since early 2021) and suggesting that this market is perhaps overstretched and due a correction. Yet, it is worth bearing in mind that the RSI can remain overbought for prolonged periods in uptrends, and in this time, the indicator may whipsaw out of overbought territory (generally perceived as a bearish cue) a number of times before finally receding lower (put simply, several false signals can occur).
So, like last week, room for further technical buying is visible, as suggested by the space between the current price and weekly resistance, together with the uptrend, though fresh countertrend selling and profit-taking could equally be just around the corner.
Daily support to hold?
Chart studies from the daily timeframe offer support at $41,500, a level entering the fight following a feisty decline from resistance at $43,828. Now, resistance beyond current levels can be seen at $45,525, positioned just south of the weekly resistance area noted above. However, if price dips a toe in waters beneath $41,500 this week, a bearish setting to as far south as support from $37,624 may be seen. Importantly, this level of support is joined closely by a 1.272% Fibonacci projection ratio at $37,360 (a potential ‘alternate’ AB=CD harmonic bullish pattern) and a 38.2% Fibonacci retracement ratio around the same level. You might also acknowledge that the daily supports closely share chart space with weekly support highlighted above at $38,523. Hence, this may be recognised as representing a solid support area should price test the base this week.
This week?
While not out of the question, given the strength of buyers in recent weeks and the current uptrend, a correction as far south as daily support around $37,624 may be a challenge. Consequently, there’s an increased probability that buyers could defend current support on the daily timeframe at $41,500 and reach for the area between the lower boundary of weekly resistance at $46,112 and daily resistance at $45,525.
As for shorts, the Research team recently highlighted that from the aforementioned resistance between weekly and daily charts, you’d unlikely observe many commit initially from this zone. If the unit does rotate southbound from the resistance, it will likely be gradual rather than an abrupt push lower, which will provide traders/investors with the opportunity to assess price action and evaluate if there is bearish interest before committing.
Charts: TradingView
This material on this website is intended for illustrative purposes and general information only. It does not constitute financial advice nor does it take into account your investment objectives, financial situation or particular needs. Commission, interest, platform fees, dividends, variation margin and other fees and charges may apply to financial products or services available from FP Markets. The information in this website has been prepared without taking into account your personal objectives, financial situation or needs. You should consider the information in light of your objectives, financial situation and needs before making any decision about whether to acquire or dispose of any financial product. Contracts for Difference (CFDs) are derivatives and can be risky; losses can exceed your initial payment and you must be able to meet all margin calls as soon as they are made. When trading CFDs you do not own or have any rights to the CFDs underlying assets.
FP Markets recommends that you seek independent advice from an appropriately qualified person before deciding to invest in or dispose of a derivative. A Product Disclosure Statement for each of the financial products is available from FP Markets can be obtained either from this website or on request from our offices and should be considered before entering into transactions with us. First Prudential Markets Pty Ltd (ABN 16 112 600 281, AFS Licence No. 286354).
Recommended Content
Editors’ Picks
Bitcoin sets the stage for a potential “destruction of fiat currency“

In a recent tweet on the social media platform X, formerly Twitter, Peter Brandt, a seasoned analyst, suggested that Bitcoin (BTC) price could be due for a massive uptrend. He compared the current BTC consolidation to the Stagflation Crisis of 1970.
Whales are quietly sizing up on this Ethereum Layer 2 token Premium

During times of muted volatility, it is better to be in the trenches instead of figuring out if and what button you should be clicking. And whales are doing exactly that with Polygon (MATIC), a well-known Ethereum Layer 2 token.
Arkham price consolidation could yield fruitful double-digit returns

Arkham (ARKM) price has shown signs of consolidation that could easily propel higher. Due to the current volatility, it is unlikely to break out without providing an accumulation opportunity.
Why are meme coins crashing?

Meme coins like Shiba Inu, Dogwifhat and Floki are all down nearly double digits. The social volume of these dog-themed crypto coins has plummeted even more in the past 24 hours.
Bitcoin: BTC likely to provide another buying opportunity Premium

Bitcoin (BTC) price looks weak on the lower timeframes, which might provide opportunities to accumulate. The daily and weekly charts retain their bullish outlook and suggest that the continuation of the 2023 bull run is not a question of “if” but “when.”