
Advertisement
Advertisement
BTC Bulls to Retarget $31,500 on US CPI Report and ETF-News
By:
It was a mixed start to the day for BTC today. While ETF-related news provides support, investors will be mindful of the US CPI Report out later today.

In this article:
Key Insights:
- On Tuesday, BTC joined the broader crypto market in the green, gaining 0.81% to end the day at $30,714.
- It was a quiet Tuesday session, with easing Fed Fear and ETF-related news providing support.
- The technical indicators turned bullish, signaling a run at $32,000.
On Tuesday, bitcoin (BTC) rose by 0.81%. Following a 0.59% gain on Monday, BTC ended the day at $30,714. However, BTC fell short of the $31,000 handle for the fourth time in five sessions.
Bitcoin (BTC) Price Action
This morning, BTC was down 0.36% to $30,602. A mixed start to the day saw BTC rise to an early high of $30,722 before falling into the red.
Daily Chart
The Daily Chart showed BTC/USD test resistance at the lower level of the $30,750 – $31,250 resistance band for the second consecutive day before falling back.
However, BTC/USD remained above the 50-day ($29,051) and 200-day ($26,432) EMAs, signaling bullish momentum over the near and long term.
Notably, the 50-day EMA continued to pull away from the 200-day EMA and reflected bullish momentum.
Looking at the 14-Daily RSI, the 59.60 reading signaled a bullish outlook and aligned with the 50-day and 200-day EMAs, supporting a run at the $30,750 – $31,250 resistance band.

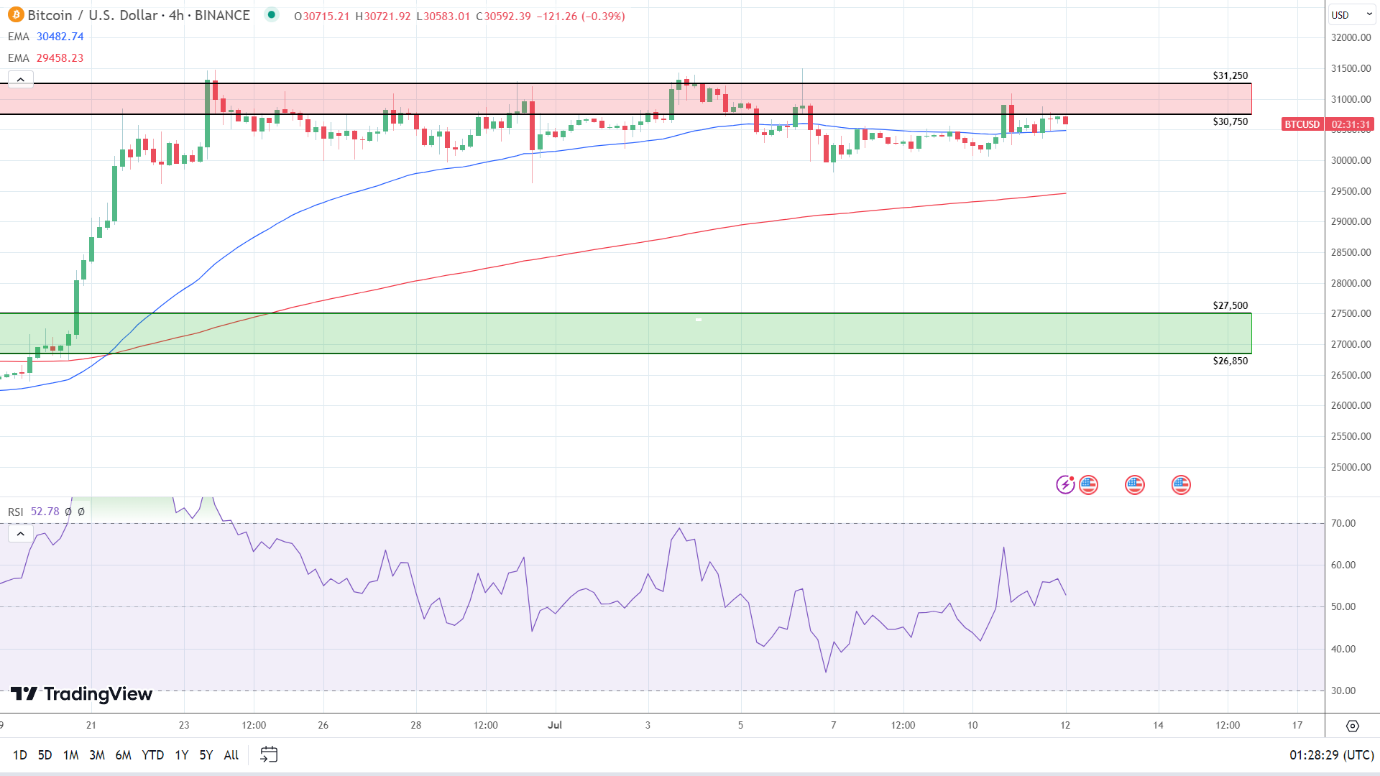
4-Hourly Chart
Looking at the 4-Hourly Chart, the BTC/USD faces strong resistance at the $31,000 psychological level. BTC/USD sits above the 50-day ($30,483) and 200-day ($29,458) EMAs, sending bullish near and longer-term signals.
Significantly, the 50-day EMA pulled away from the 200-day EMA, signaling a move through the lower level of the $30,750 – $31,250 resistance band to target $31,250.
However, a fall through the 50-day EMA ($30,483) would bring the 200-day EMA ($29,458) into view.
The 14-4H RSI reading of 52.78 indicates a moderately bullish stance and aligns with the 50-day EMA, with buying pressure outweighing selling pressure. Significantly, the RSI signals near-term bullish momentum and a breakout from the lower level of the $30,750 – $31,250 resistance band to target $31,250.
Easing Fed Fear and ETF News Delivered Support
It was a quiet Tuesday session, with no economic indicators or FOMC member speeches to consider. The lack of US economic indicators left Fed chatter from Monday to resonate.
ETF-related news provided further price support. On Tuesday, the Cboe refiled applications for five Bitcoin-ETFs, raising hopes of a surge in crypto adoption.
The Day Ahead
It is a busier Wednesday session. The all-important US CPI Report will be in focus this afternoon. Stickier inflation would fuel bets on a more hawkish September Fed interest rate hike and push back the timing of a first interest rate cut to 2024.
However, a cooler-than-expected headline figure should support a bullish session, with investors hoping for a nearer-term end to the Fed monetary policy tightening cycle.
Beyond the US economic calendar, investors should track ETF chatter, with Binance and SEC v Ripple-related news likely to also be focal points.
About the Author
Bob Masonauthor
With over 20 years of experience in the finance industry, Bob has been managing regional teams across Europe and Asia and focusing on analytics across both corporate and financial institutions. Currently he is covering developments relating to the financial markets, including currencies, commodities, alternative asset classes, and global equities.
Did you find this article useful?
Latest news and analysis


Advertisement