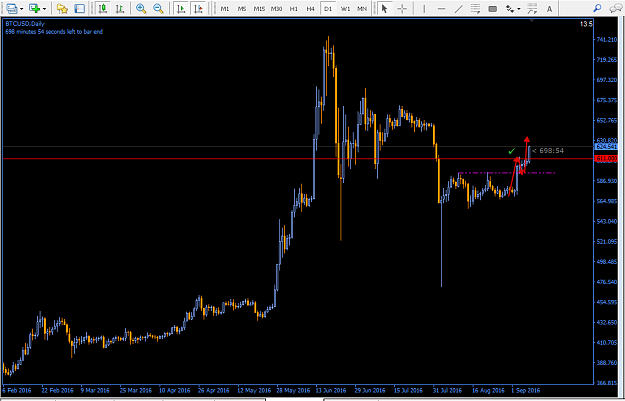
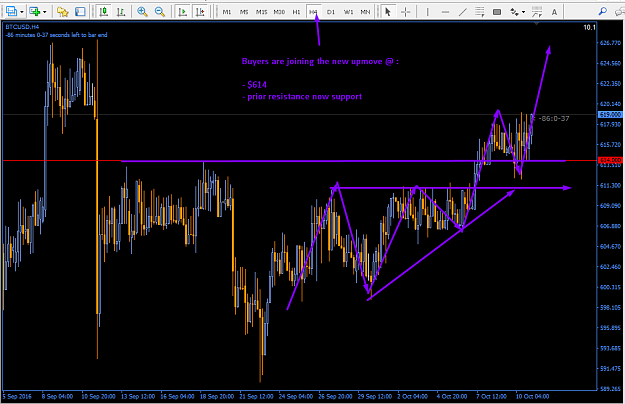
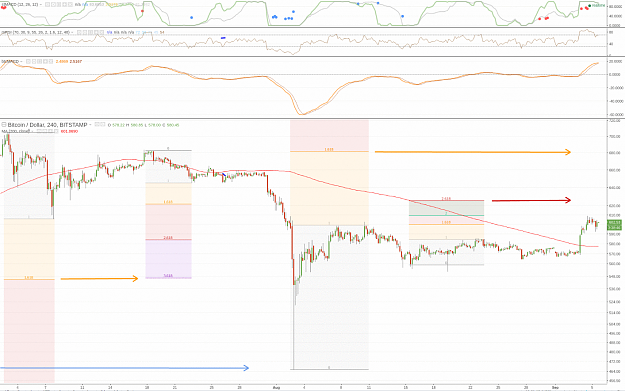
Posting the 4hr chart that I used to open a long position at the juncture where price crossed over its 4hr 200MA while MACD advanced through its zero line.
The trade plan is similar to that described by @andoseg2 in the previous post:
1) moderate quarter position size with a $10 stop loss
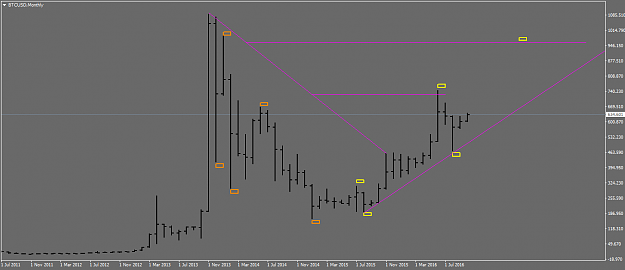
2) anticipate a primary target at $680 which is a multi-year pivot
3) this is believed to be a subwave of a larger wave of advance, so reversal from $680 should return price to the vicinity of $600 and consolidate into the next wave of advance to a new high.
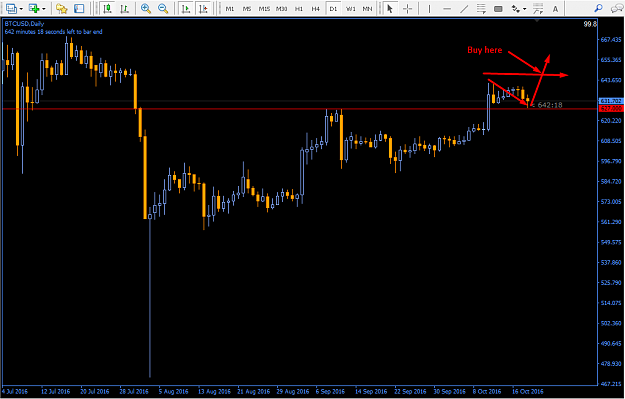
Entry can be safely made at the current $600 (Bitstamp) according to the trade parameters listed above.
Bitstamp 4hr candle chart
The trade plan is similar to that described by @andoseg2 in the previous post:
1) moderate quarter position size with a $10 stop loss
2) anticipate a primary target at $680 which is a multi-year pivot
3) this is believed to be a subwave of a larger wave of advance, so reversal from $680 should return price to the vicinity of $600 and consolidate into the next wave of advance to a new high.
Entry can be safely made at the current $600 (Bitstamp) according to the trade parameters listed above.
Bitstamp 4hr candle chart
Attached Image (click to enlarge)
cryptocurrency everytime