As promised, here is tonight's Bitcoin technical market update.
Please donate here if you wish to see it continued:
14TeeHy4igXUgfnjXmCFG5MwkcRKZRkprS
Longterm: RALLY.
Midterm: SIDEWAYS
Shortterm: RALLY / SIDEWAYS
Color legend: Green: UP, Purple: SIDEWAYS, Red: DOWN.
Analysis
1. Price action review over the past days:
We forecast in the latest twitter updates: "BTC/USD in narrow trading range between 8.1$ and 9$. Breakout on either side could set a new trend."
Indeed, BTC/USD has been trading in a narrow range for a while and recently moved to hitting 9 $ resistance.
2. Longterm outlook:
The longterm "BitBull-Market" is on track and can move higher in the next weeks. At the same time, there are some watch outs when looking at the midterm picture (past 45 days, see midterm outlook below).
http://blog.bitcoinwatch.com/wp-cont...30dailylog.png
As previously mentioned, a break below the 5$ area would trigger a deeper correction towards 3.5 - 3.7 $ and ultimately 1.2-1.3$. Even when BTC/USD would hit the latter price zone, the longterm uptrend is still intact.
2. Mid term update (I am adding this time zone which I will cover specifically to subscribers as of Jun 1, 2011. http://bit.ly/mjP1Rh)
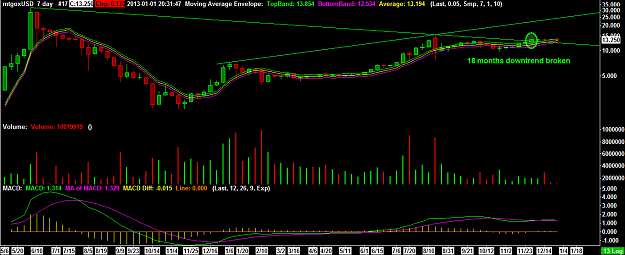
As mentioned above, the past 45 days show a strong trend upwards. BTC/USD prices rose from 1$ to 9.3$ in just this short period of time.
Prices are sitting now exactly on this uptrend line, which, if broken to the downside, could trigger a more protracted decline. There are a few more watch outs (momentum, relative strength divergences), which should provide some caution.
Staying above will likely extend the rally.
http://blog.bitcoinwatch.com/wp-cont...urly45dlog.png
3. Short term update
Bitcoins "adhered" nicely to the forecast issued in the last May 26 analysis: "As long as the 7.8-8.2$ range holds, [higher levels are] in the cards. A break below would be the first warning sign that the latest rally leg has ended."
The short/ midterm trend is sideways between 9 (9.3) and 8.1$. Patient traders could await a breakout in either direction, based on the two key scenarios:
Scenario 1)
A breakout above 9.0-9.3$ could lead to hitting the 10$ level, which poses strong resistance. A strong break of 10$ could then ultimately lead to 14$ and 18-22$ (the upper range of the parallel trendchannel).
Scenario 2)
A break down below 8.1 $ would trigger further correction potential down to typical fibonacci retracements of
38%: 7.8-7.9$
50%: 7.4 $
62%: 7.0 $
Please watch out that going below 8.7-8.9 $ already creates a warning sign - as it means the mid-term trend is broken.
http://blog.bitcoinwatch.com/wp-cont...urly45dlog.png
Trade Bitcoins well!
Your S3052
Disclaimer: Please always do your own due diligence, and consult your financial advisor. S3052 owns some bitcoins. Never invest unless you can afford to lose your entire investment.
Your S3052
Disclaimer: Please always do your own due diligence, and consult your financial advisor. Never invest unless you can afford to lose your entire investment.
Please donate here if you wish to see it continued:
14TeeHy4igXUgfnjXmCFG5MwkcRKZRkprS
Longterm: RALLY.
Midterm: SIDEWAYS
Shortterm: RALLY / SIDEWAYS
Color legend: Green: UP, Purple: SIDEWAYS, Red: DOWN.
Analysis
1. Price action review over the past days:
We forecast in the latest twitter updates: "BTC/USD in narrow trading range between 8.1$ and 9$. Breakout on either side could set a new trend."
Indeed, BTC/USD has been trading in a narrow range for a while and recently moved to hitting 9 $ resistance.
2. Longterm outlook:
The longterm "BitBull-Market" is on track and can move higher in the next weeks. At the same time, there are some watch outs when looking at the midterm picture (past 45 days, see midterm outlook below).
http://blog.bitcoinwatch.com/wp-cont...30dailylog.png
As previously mentioned, a break below the 5$ area would trigger a deeper correction towards 3.5 - 3.7 $ and ultimately 1.2-1.3$. Even when BTC/USD would hit the latter price zone, the longterm uptrend is still intact.
2. Mid term update (I am adding this time zone which I will cover specifically to subscribers as of Jun 1, 2011. http://bit.ly/mjP1Rh)
As mentioned above, the past 45 days show a strong trend upwards. BTC/USD prices rose from 1$ to 9.3$ in just this short period of time.
Prices are sitting now exactly on this uptrend line, which, if broken to the downside, could trigger a more protracted decline. There are a few more watch outs (momentum, relative strength divergences), which should provide some caution.
Staying above will likely extend the rally.
http://blog.bitcoinwatch.com/wp-cont...urly45dlog.png
3. Short term update
Bitcoins "adhered" nicely to the forecast issued in the last May 26 analysis: "As long as the 7.8-8.2$ range holds, [higher levels are] in the cards. A break below would be the first warning sign that the latest rally leg has ended."
The short/ midterm trend is sideways between 9 (9.3) and 8.1$. Patient traders could await a breakout in either direction, based on the two key scenarios:
Scenario 1)
A breakout above 9.0-9.3$ could lead to hitting the 10$ level, which poses strong resistance. A strong break of 10$ could then ultimately lead to 14$ and 18-22$ (the upper range of the parallel trendchannel).
Scenario 2)
A break down below 8.1 $ would trigger further correction potential down to typical fibonacci retracements of
38%: 7.8-7.9$
50%: 7.4 $
62%: 7.0 $
Please watch out that going below 8.7-8.9 $ already creates a warning sign - as it means the mid-term trend is broken.
http://blog.bitcoinwatch.com/wp-cont...urly45dlog.png
Trade Bitcoins well!
Your S3052
Disclaimer: Please always do your own due diligence, and consult your financial advisor. S3052 owns some bitcoins. Never invest unless you can afford to lose your entire investment.
Your S3052
Disclaimer: Please always do your own due diligence, and consult your financial advisor. Never invest unless you can afford to lose your entire investment.