I reviewed the longterm charts and thought I should share this with you immediately.
Please donate:
1P8iS7WLx5n4ixThBRCPEPk9A3dR8bV6qt
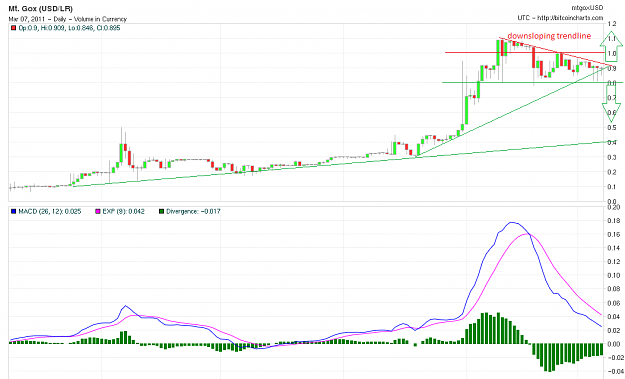
As mentioned in Friday's update, Bitcoin/USD have started a correction after breaking below the decisive 1$ mark as highlighted previously. The key question is how far could this correction go?
To get a better picture, I reviewed the longterm chart, using logarithmic scale which is most appropriate for this strongly rising market.
Key indicators continue to be strongly bearish: The MACD crossed downwards strongly for the first time in record, and Exponential Moving Average 13 has turned down.
When drawing the already often shown and proven longterm trendline through the last significant lows, it is clear that there is potential downside towards 0.5 $.
As long as prices do not break above the downsloping EMA 13 (at 0.89 $), the downtrend is intact.
A break above 1.0 $ enables a further rally to 1.1$ (all time high, and then higher towards 1.5$, 2$, etc.)
http://mtgox.com/blog/wp-content/upl...0220daily1.bmp
Your S3052
Please donate:
1P8iS7WLx5n4ixThBRCPEPk9A3dR8bV6qt
As mentioned in Friday's update, Bitcoin/USD have started a correction after breaking below the decisive 1$ mark as highlighted previously. The key question is how far could this correction go?
To get a better picture, I reviewed the longterm chart, using logarithmic scale which is most appropriate for this strongly rising market.
Key indicators continue to be strongly bearish: The MACD crossed downwards strongly for the first time in record, and Exponential Moving Average 13 has turned down.
When drawing the already often shown and proven longterm trendline through the last significant lows, it is clear that there is potential downside towards 0.5 $.
As long as prices do not break above the downsloping EMA 13 (at 0.89 $), the downtrend is intact.
A break above 1.0 $ enables a further rally to 1.1$ (all time high, and then higher towards 1.5$, 2$, etc.)
http://mtgox.com/blog/wp-content/upl...0220daily1.bmp
Your S3052