BTC: Price: $9,870 | MCAP: $177.75 billion | 24-Hr Volume: $17.27 billion
Short-term trend: Bearish
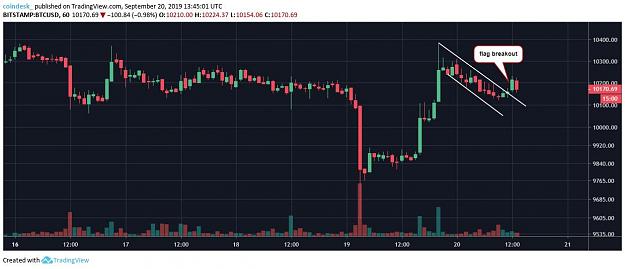
Bitcoin fell to an 18-day low of $9,600 today validating the bearish setup on the 4-hour chart: a failed wedge breakout followed by a bearish lower high.
A deeper drop to levels below $9,500 could be in the offing. Supporting the bearish case are key indicators like the 14-day relative strength index and the weekly moving average converge histogram.
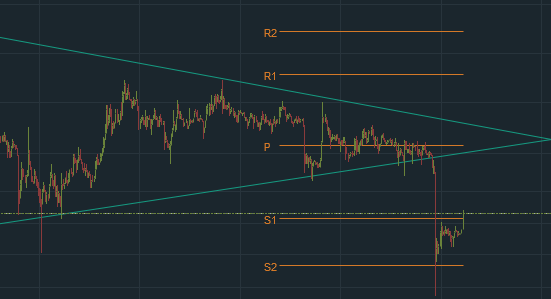
The bearish case would weaken if prices rise above $10,458, invalidating the bearish lower highs setup on the 4-hour chart. The outlook, however, would turn bullish only if prices print a UTC close above $10,958 – the upper edge of a three-month-long contracting triangle on the daily chart.
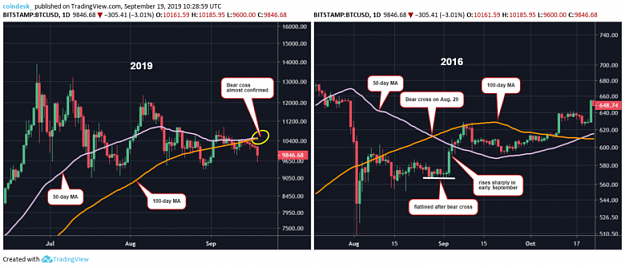
The 50- and 100-day moving averages are about to produce a bearish crossover for the first time since September 2018. The long-term MA crossovers, however, are lagging indicator known to trap sellers on the wrong side of the market.
Long-term trend: Neutral
Short-term trend: Bearish
Bitcoin fell to an 18-day low of $9,600 today validating the bearish setup on the 4-hour chart: a failed wedge breakout followed by a bearish lower high.
A deeper drop to levels below $9,500 could be in the offing. Supporting the bearish case are key indicators like the 14-day relative strength index and the weekly moving average converge histogram.
The bearish case would weaken if prices rise above $10,458, invalidating the bearish lower highs setup on the 4-hour chart. The outlook, however, would turn bullish only if prices print a UTC close above $10,958 – the upper edge of a three-month-long contracting triangle on the daily chart.
The 50- and 100-day moving averages are about to produce a bearish crossover for the first time since September 2018. The long-term MA crossovers, however, are lagging indicator known to trap sellers on the wrong side of the market.
Long-term trend: Neutral
Attached Image (click to enlarge)
Money isn't real
2