- Search Crypto Craft
- 147 Results (2 Threads , 145 Replies )
-
 kprsa replied Feb 27, 2019
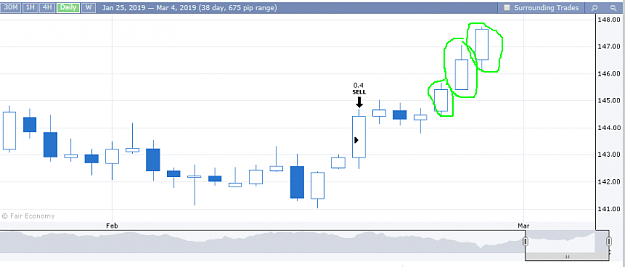
It is not super-important because this is a demo account, but I would suggest the following modification to this strategy: When you see candles of this type (i.e. almost full body candles) on the daily TF going in the direction opposite of your ...
96% Win Rate!
- kprsa replied Jan 5, 2019
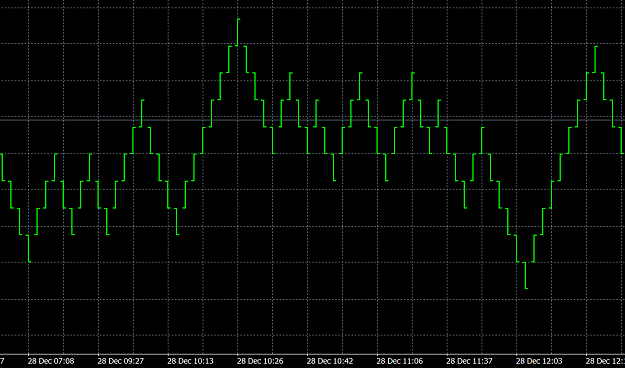
Yes. I wish to eliminate too short cycles of price which are not profitable in my strategy. Renko charts also have chop. This is one London open for oil: image
The Great Pumpkin
- kprsa replied Jan 3, 2019
New attempt at an "ideal EA". Still very much in testing and "tightening loose screws" mode. It now implements all good trading practices that I am aware of: Buys above a line, sells below it. Buys when price goes ups, sells when it goes down. Cuts ...
The Great Pumpkin
- kprsa replied Oct 31, 2018
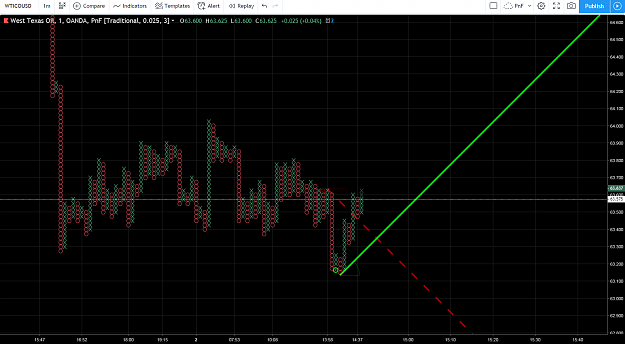
Objective trendlines (45 degrees lines) in the point and figure charts. Seem to be working quite well in the wild oil market. image (for more info see Jeremy du Plessis: "A Comprehensive Guide to the Theory and Practical Use of the Point and ...
The Great Pumpkin
- kprsa replied Apr 26, 2018
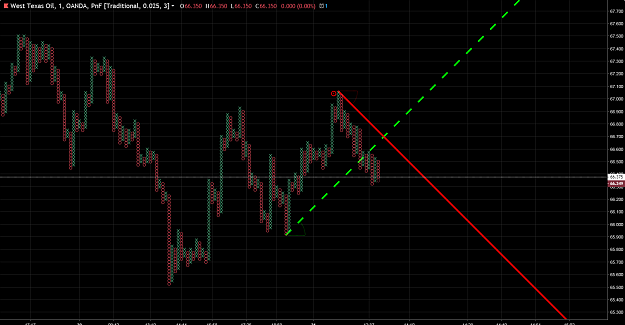
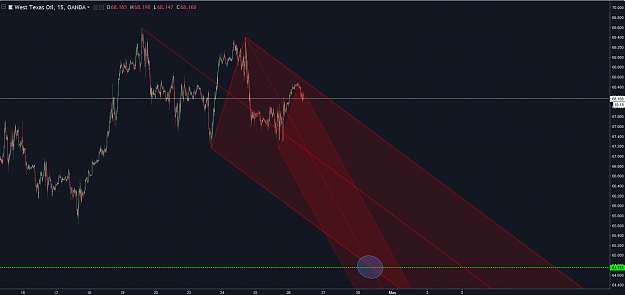
A nice double-fork pattern for confirmation of the expected support line and further restriction of possible target time. k image
The Great Pumpkin
- kprsa replied Mar 28, 2018
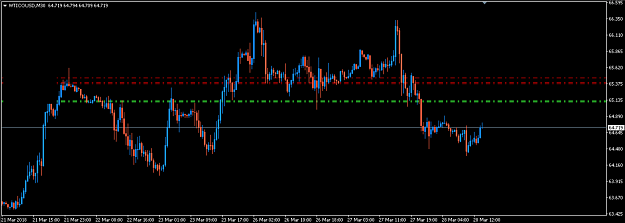
It is likely the current push down proceeds imho. I have set up some traps to catch the pullback (I missed the opportunity yesterday by a few cents
Oil and Natural Gas ). k image
- kprsa replied Mar 7, 2018
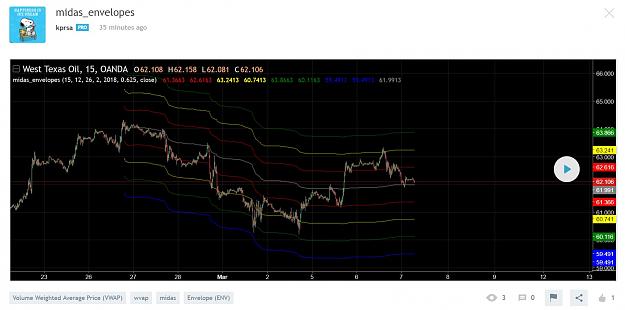
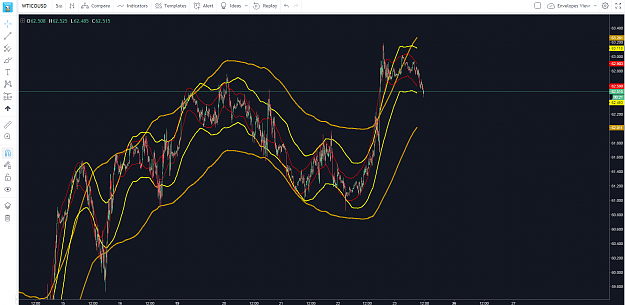
The TradingView script midas_envelopes is here. It can also be found among the public indicators. Due to technical restrictions in the TV scripting language, one must specify the date and time of the significant high or low, rather than plotting a ...
The Great Pumpkin
- kprsa replied Mar 7, 2018
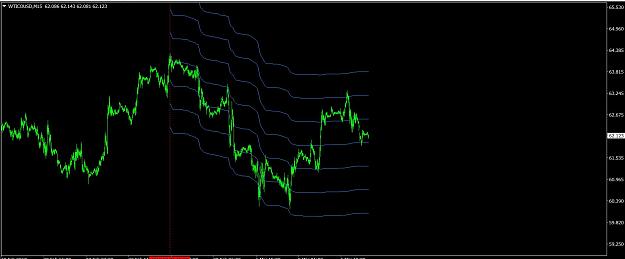
Midas envelopes mt4 version Usage: 1. One places a Vertical Line on the graph. 2. Rename the vertical line to "V1" (or whatever short name you prefer) 3. Put the indicator on the graph 4. Select the parameters file image Cheers, k
The Great Pumpkin
- kprsa replied Mar 5, 2018
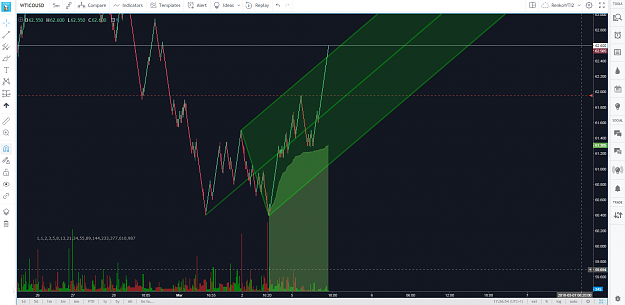
Oil chart dump. Managed to catch the first pullback using the (modified) MIDAS method. Now waiting for trend to stop, i.e. the pitchfork to stop being relevant. The price may have overshot now, but oil impulse moves can be quite crazy... k image
The Great Pumpkin
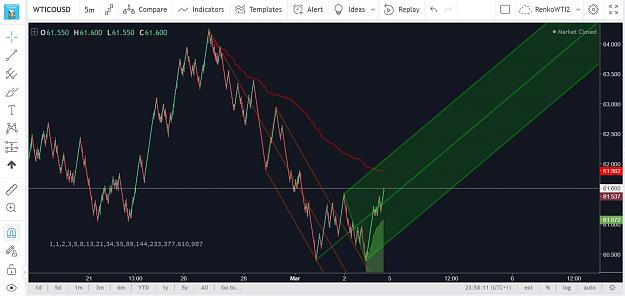
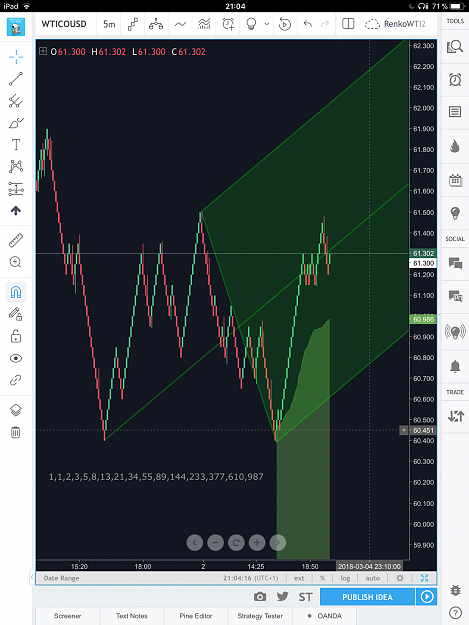
- kprsa replied Mar 3, 2018
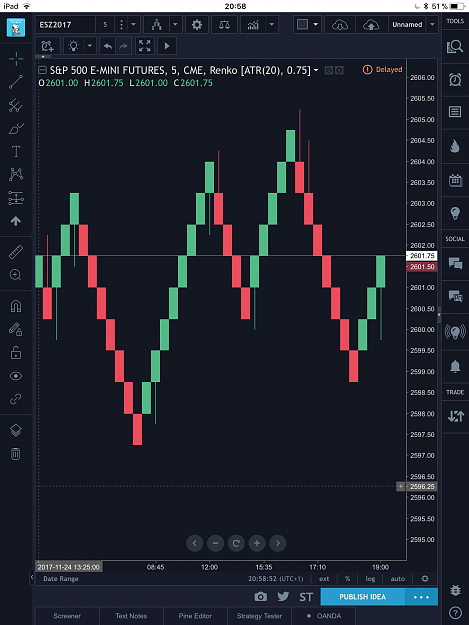
Oil (OANDA:WTICOUSD), 5 cent Renko chart Cheers, k image
Charting with Median Lines
- kprsa replied Feb 23, 2018
Sometimes one does get hit by a truck, but it is impossible to catch her unless you try...
Why members share strategies? image
image
- kprsa replied Feb 23, 2018
On oil there is a pullback going on currently, I will probably enter the uptrend as soon as the pullback starts failing. k image
Analysis and Trading based on Envelopes, Waves, Cycles
- kprsa replied Feb 20, 2018
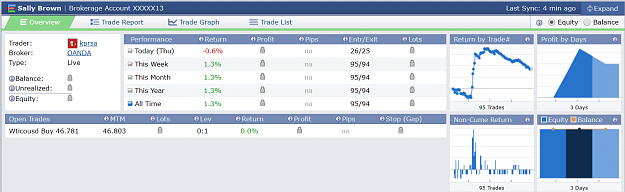
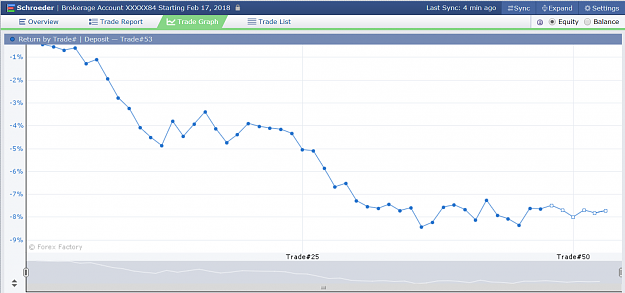
Note to self: It is REALLY difficult to write an EA that works all the time. image The Balance curve basically indicates that it is not worthwhile running this EA outside the NY session. Only then the price movements are sufficiently large for it ...
The Great Pumpkin
- kprsa replied Feb 11, 2018
Like clockwork.
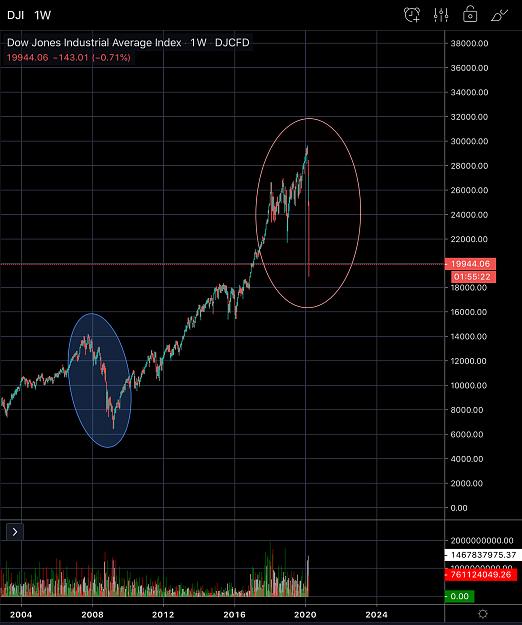
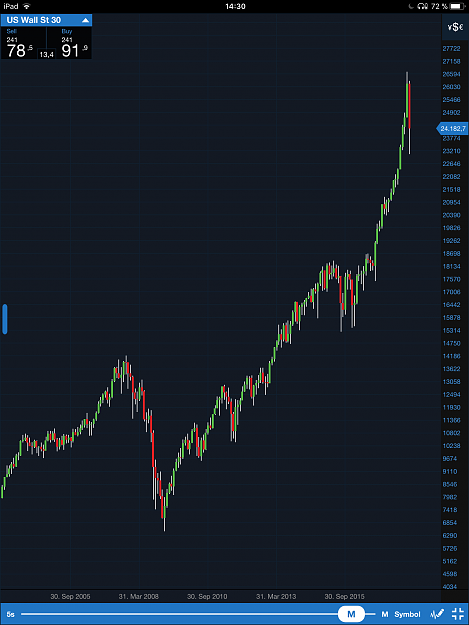
The Great Pumpkin Hopefully Trump’s corporate tax reform wins this market test. Last crisis (pullback to Dow uptrend) shattered much of southern EU economies... image
- kprsa replied Dec 4, 2017
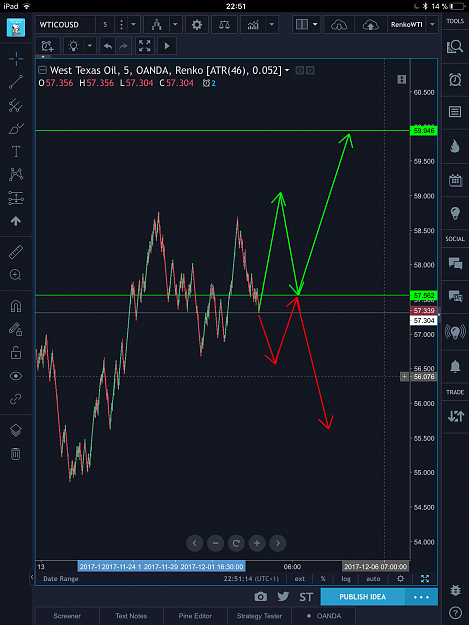
How I see it (both directions are possible, I still think up is more likely at the moment): image
Oil and Natural Gas
- kprsa replied Nov 28, 2017
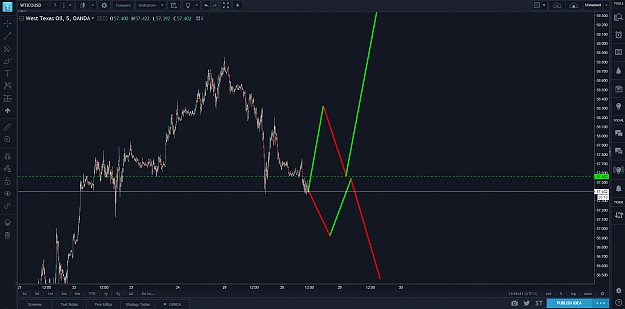
Dangerous position: A lot of downward pressure. Looks like the bulls are slowly starting to lose the battle. I'd like to see 60 being reached in the last push up and then would be looking for shorts. Cheers, k Edit: options as far as I can see them. ...
Oil and Natural Gas