- Search Crypto Craft
- 54 Results
-
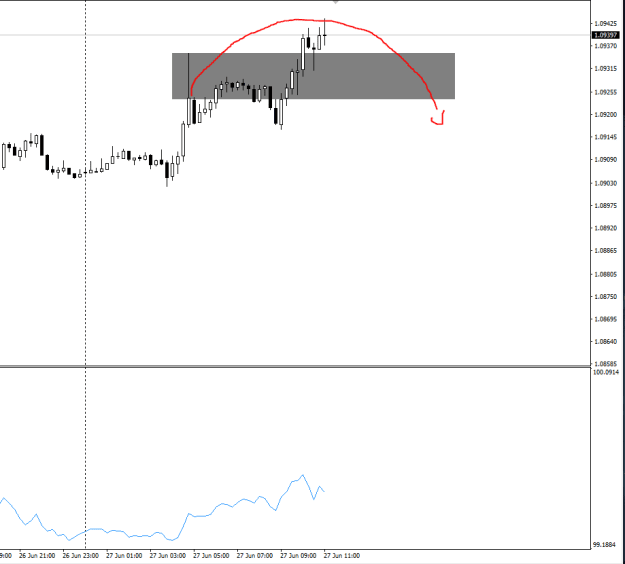
 Zookeeper85 replied Aug 23, 2023
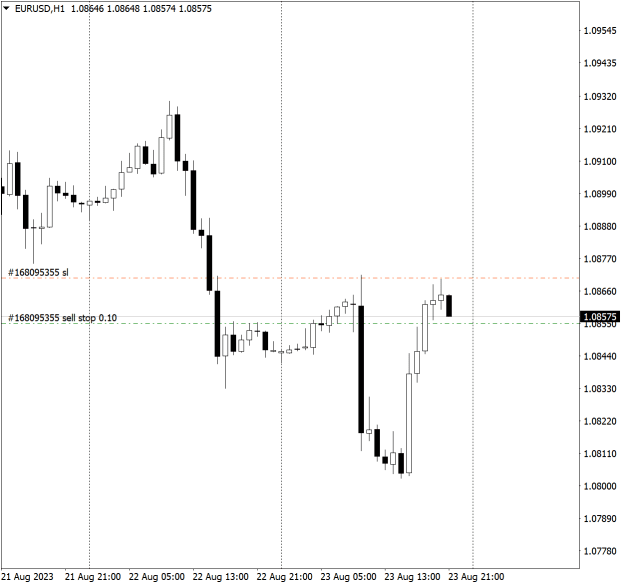
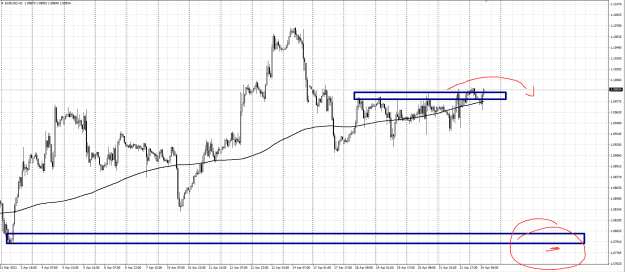
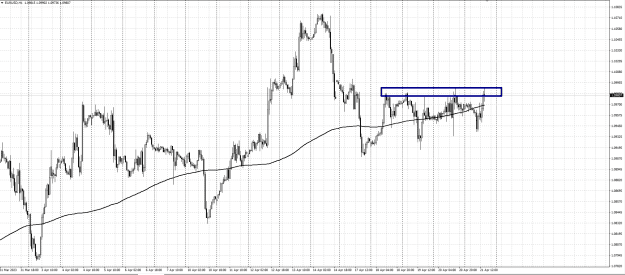
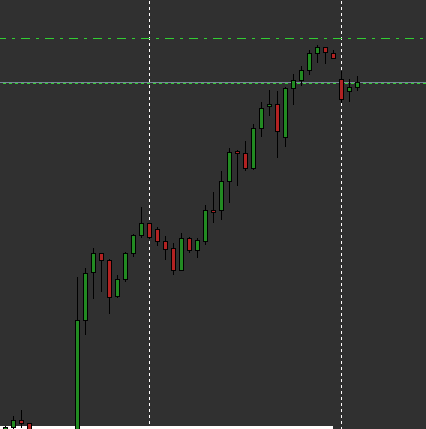
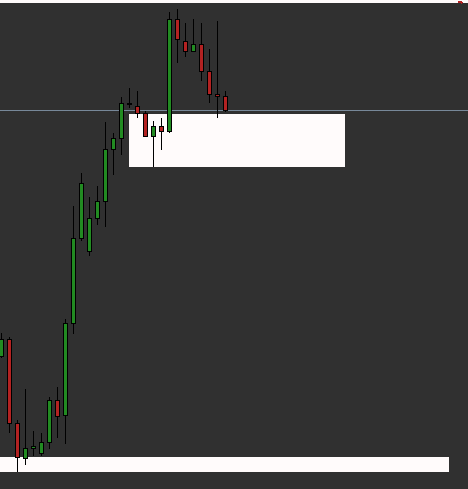
Place a sell stop order at 1.08550 as long as we maintain the high from last hour
EURUSD only
- Zookeeper85 replied Aug 21, 2023
I see your point! Even though the thread isn't directly about correlation, I thought it would be prudent to mention it. Buying the EURUSD and selling the GBPUSD is essentially equivalent to buying the EURGBP vice versa. For this reason, it's ...
A Simple Mean Reversion Strategy
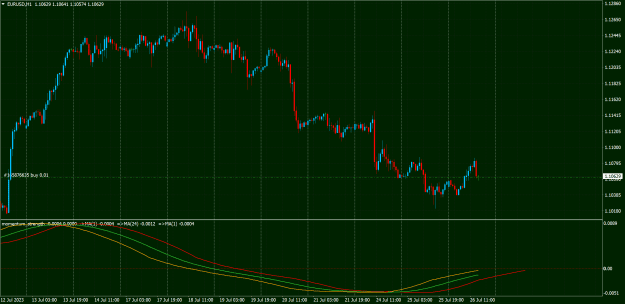
- Zookeeper85 replied Aug 17, 2023
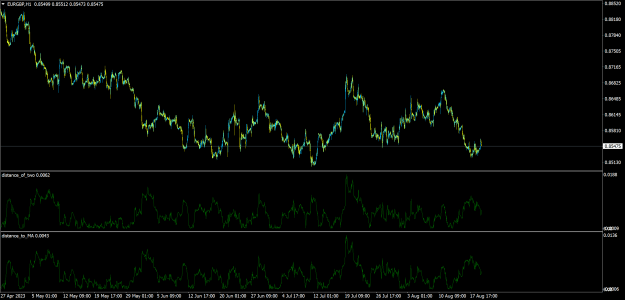
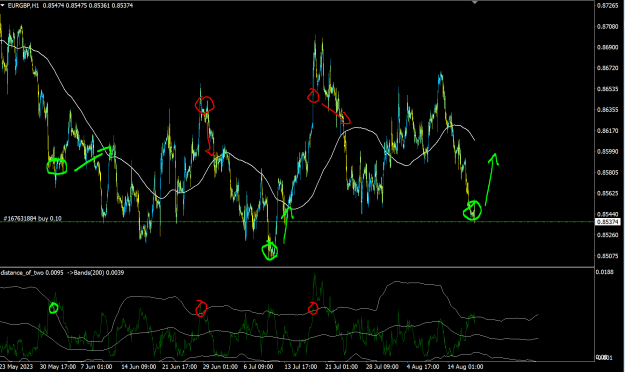
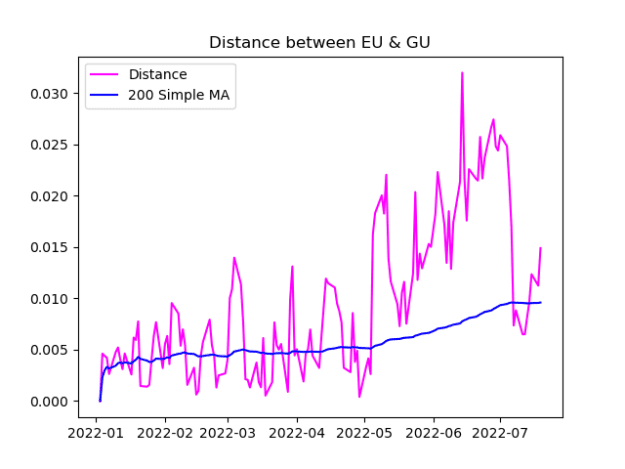
The indicator below plots the distance between the MA-200 of EURUSD and the MA-200 of GBPUSD. I've added Bollinger Bands to it to observe when the distance is "high"... here are some entry points.
A Simple Mean Reversion Strategy
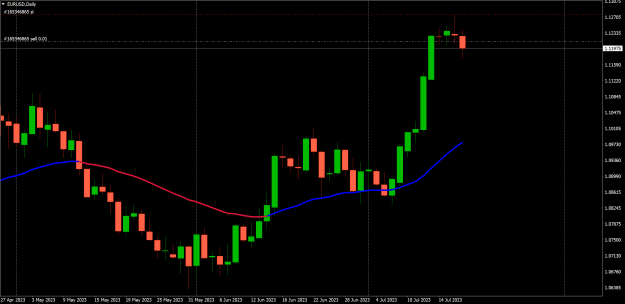
- Zookeeper85 replied Apr 24, 2023
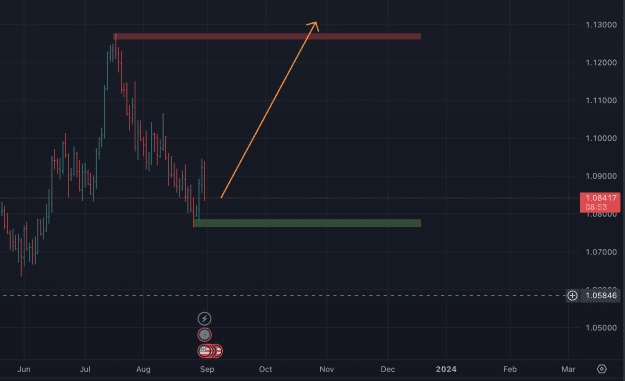
My bias is still very bearish... IMO EU will test 1.08x soon.
EURUSD only
- Zookeeper85 replied Nov 13, 2022
I opened a sell trade, R/R is awesome. Should eu take out Friday's high, I'll hedge my position with a buy stop and see what happens over the day.
EURUSD only
- Zookeeper85 replied Nov 9, 2022
hmm... I really want to buy EURUSD - let's wait to see how todays candle closes.
EURUSD only
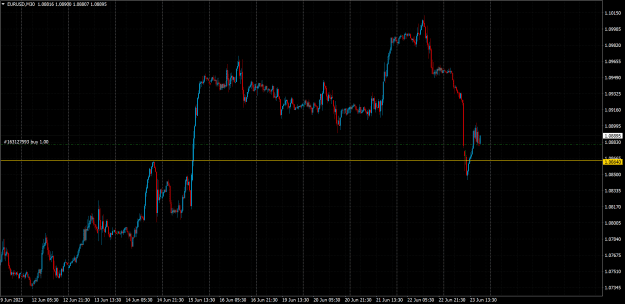
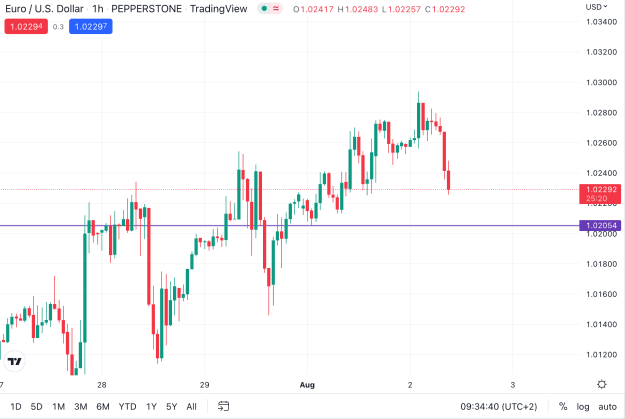
- Zookeeper85 replied Aug 2, 2022
Lots of retail sells this morning. I'm buying on yesterdays low.
EURUSD only
- Zookeeper85 replied Jul 21, 2022
I played around with the 'Cumulative Delta MT5' indicator a bit today. Remember that the indicator will readjust with the settings in the template. The indicator author wrote: 'By default, the initial reference point is the very first candle from ...
Using volume to predict price movements
- Zookeeper85 replied Jul 19, 2022
Since we want to buy/sell if distance between a & b is higher > average, here is a chart showing distance (a-b) vs average of distance. Distance > average EU > GU Means we sell EU and buy GU
Correlated Currency Divergence Strategy
- Zookeeper85 replied Jul 19, 2022
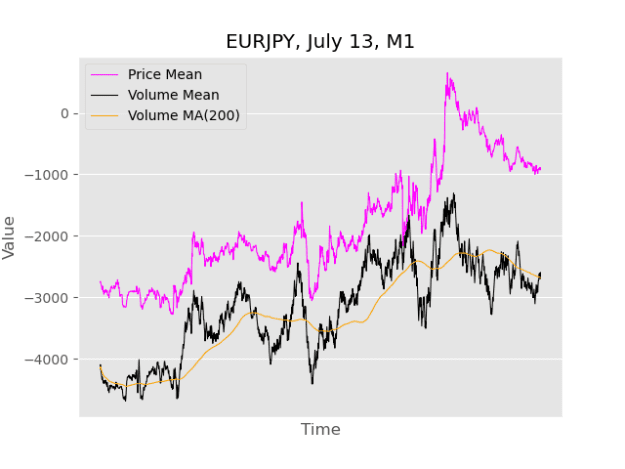
Hi Charli, What I saw is that volume drops often means a continuation in the 'right direction'. In other words: You might see an uptrend (price making new highs) and then price drops with relatively low volume.. This is exactly what happened on EJ ...
Using volume to predict price movements
- Zookeeper85 replied Jul 18, 2022
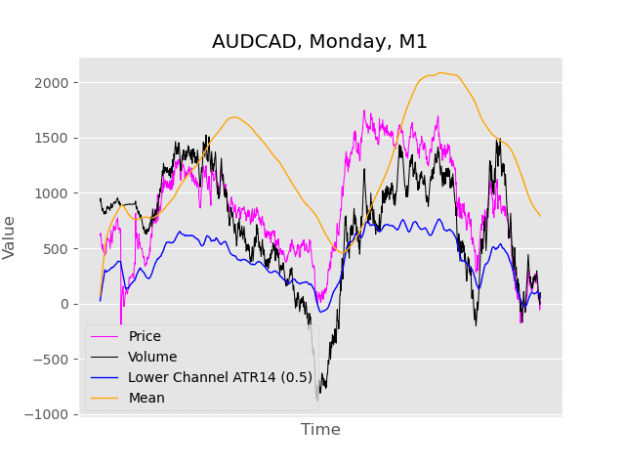
Here is my AUDCAD chart from today(m1). Instead of Bollinger bands, I used ATR today. I build a lower channel to measure when Volume is below ATR14(0.5). Conditions for buys were: volume below price volume below ATR low price below mean take profit: ...
Using volume to predict price movements
- Zookeeper85 replied Jul 18, 2022
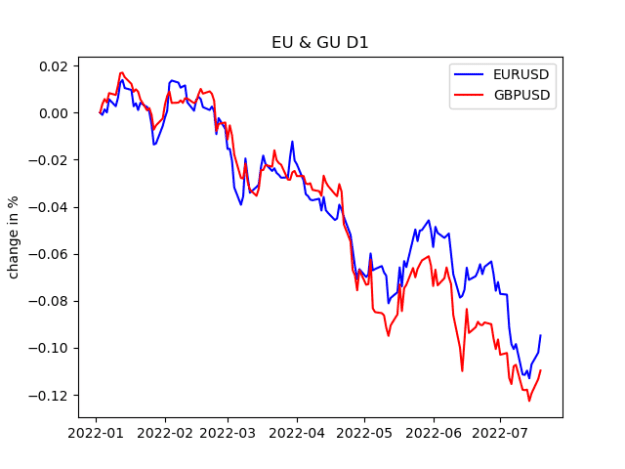
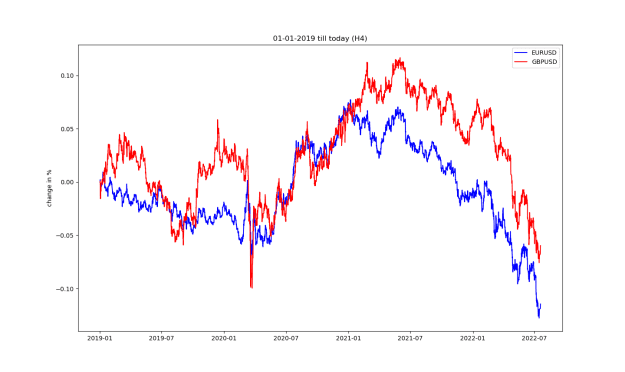
Hi Orion, do you mean something like this? It is basically just EURUSD und GBPUSD on one chart. To make it comparable, I plotted both in relative returns. You can read more about rel. returns here: url 'Speaking about Lot Size, in my original post ...
Correlated Currency Divergence Strategy
- Zookeeper85 replied Jul 17, 2022
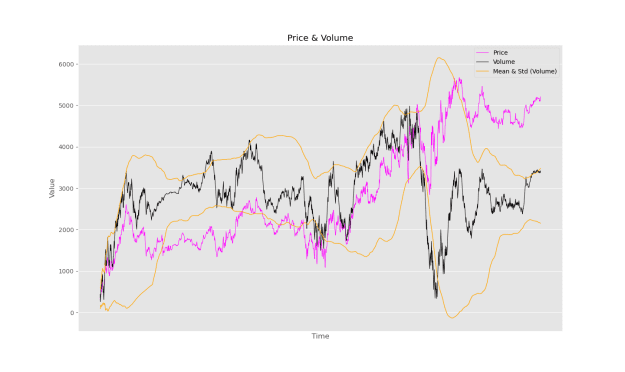
'Trading deep volume discounts' sounds like a pretty good idea. It doesn't matter whether you use the tick volume in Metatrader4 or other exotic sources. The idea remains the same. The only question is what is a volume discount? At what level is the ...
How can you track the "smart money”
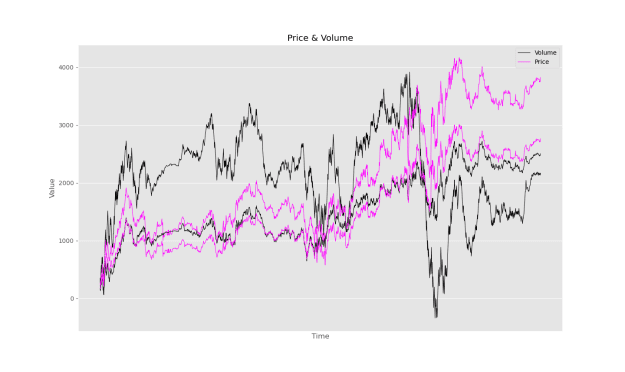
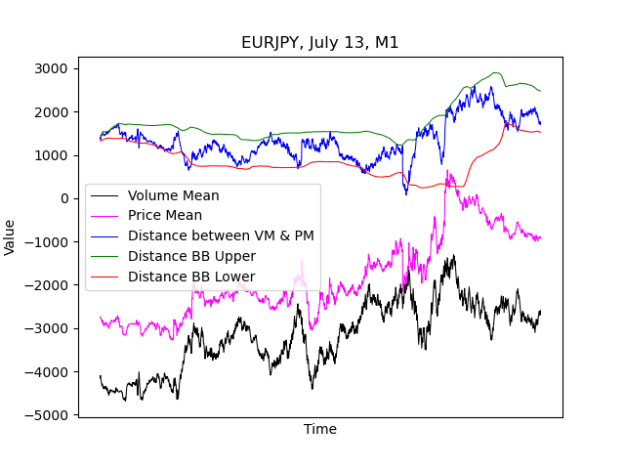
- Zookeeper85 replied Jul 16, 2022
Since the indicator is protected and therefore very difficult to modify, I read the buffer values and plotted them separately in python (fig1). I'm still having problems reading in more data (I will work on that) ... so the following charts are only ...
Using volume to predict price movements