- Search Crypto Craft
- 287 Results (1 Thread , 286 Replies )
-
 RobinHood replied Jan 19, 2024
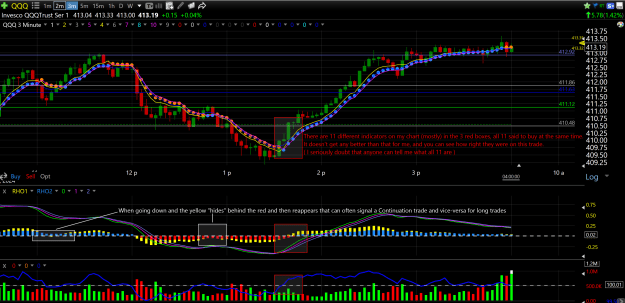
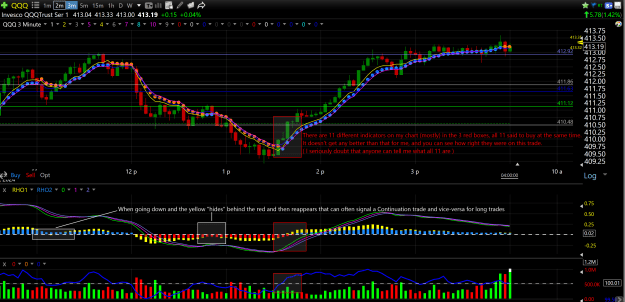
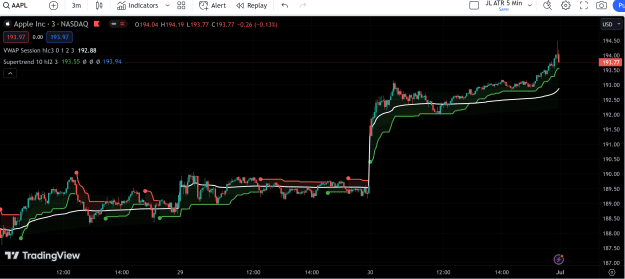
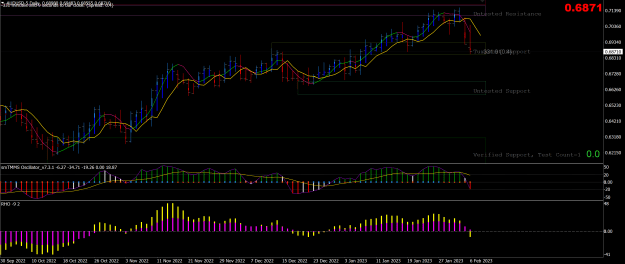
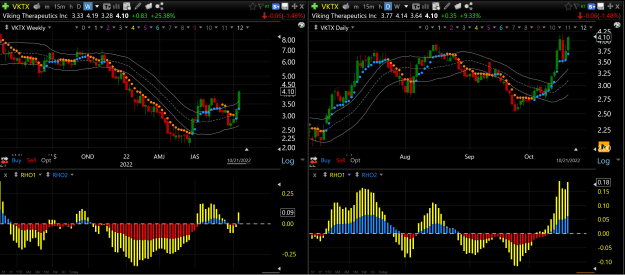
I figured that since no one took a shot at what the 11 indicators are that I mentioned on the stock chart in Post #8687 that I would list them. Here's the chart again for ease of reference: image The 11 Indicators Are: Top Window 1. The time of ...
Trading Made Simple(r)
- RobinHood replied Jan 18, 2024
Many times traders ask me simple questions just as you have that I feel "require" a more complex answer. So with that being said, I could write a book just on the different ways I use the RHO (RobinHood Oscillator), alone OR in conjunction with some ...
Trading Made Simple(r)
- RobinHood replied Jan 16, 2024
I use it on every timeframe and every chart that I trade. But I use it most often on these: 1 min. 2 min. 3 min. 5 min. 15 min. 1 hr. 4hr. daily, weekly and monthly. Which ones I use them on all depends on what and how I am trading. For example... ...
Trading Made Simple(r)
- RobinHood replied Jul 1, 2023
You're welcome! The white dashed line (on my previous chart) is called: VWAP. It stands for: Volume Weighted Average Price. VWAP is calculated by totaling the dollars traded for every transaction (price multiplied by the volume) and then dividing by ...
Trading Made Simple(r)
- RobinHood replied Jun 28, 2023
As I said in my post..."This template is not something that I want share because it has taken me about 3 years to perfect it. Hundreds and hundreds of hours". I'll tell you why I don't want to share it. It's because someone will come along and start ...
Trading Made Simple(r)
- RobinHood replied Apr 18, 2023
Thanks for creating the indicator on TV. Personally, based on the way I use it, I find it easier to read if you change both lines into a histogram. image
Trading Made Simple(r)

- RobinHood replied Apr 8, 2023
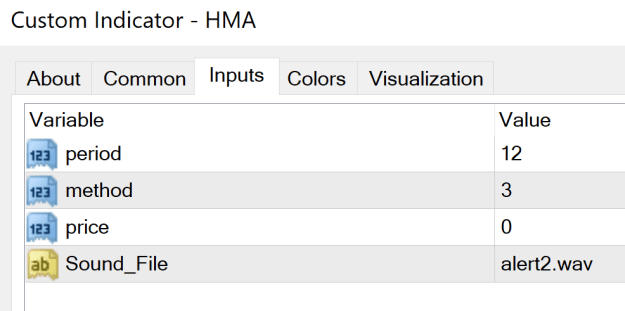
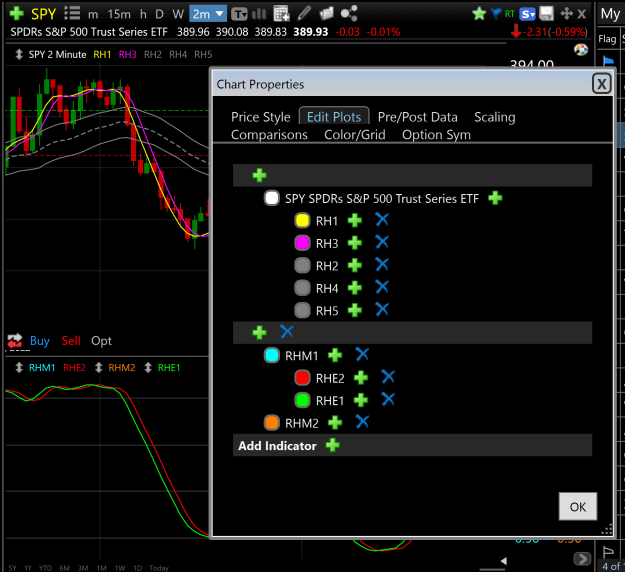
I can't help you with that as I never use my phone to trade on. But just in case you don't know, here are the HMA settings that I use: image
Trading Made Simple(r)
- RobinHood replied Apr 6, 2023
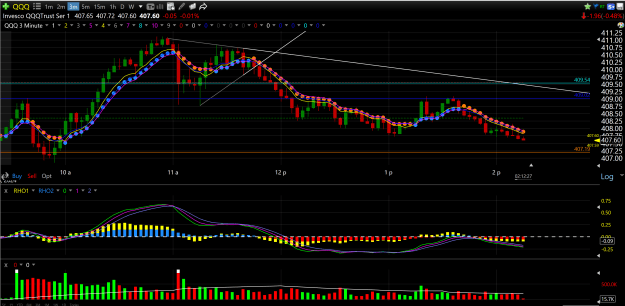
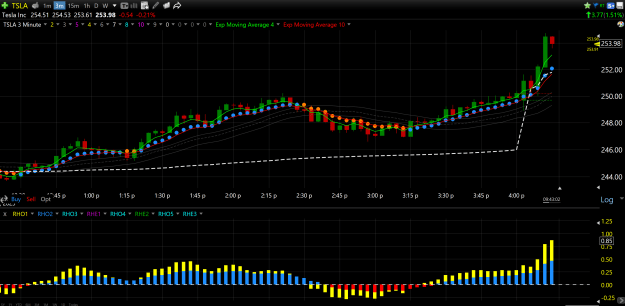
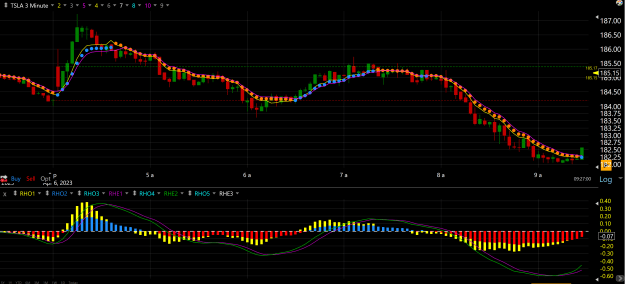
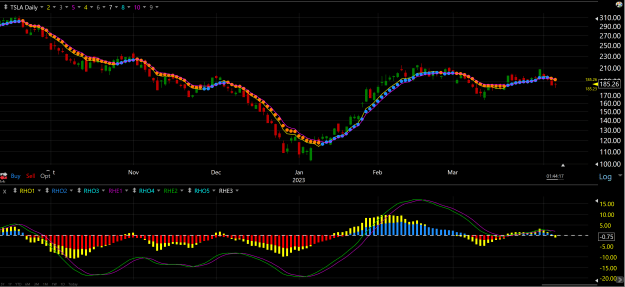
Currently, the only stock that I am day trading is Tesla...due to the volume and the volatility. Here is what my chart looks like, it's a 3 min. chart. image Here is what my Daily Tesla chart looks like. I use this exact setup to position trade ...
Trading Made Simple(r)
- RobinHood replied Apr 5, 2023
As many of you know, I have a huge library of trading books. I collect and read them as it's my only hobby and it has been for about 40 years. There 3 most important parts to trading. I call them the 3 M's of trading. They are: Mind, Method and ...
Trading Made Simple(r)

- RobinHood replied Feb 10, 2023
I only look at the next higher time frame above the one that I am trading. 4hr --->Daily Daily --->Weekly Weekly ---> Monthly As far as trades returning to BE...BE's are not a bad thing, in fact, they are quite the opposite. Their only purpose is to ...
Trading Made Simple(r)
- RobinHood replied Feb 6, 2023
A few days ago a trader pal of mine (here on FF) who I had not heard from for a while asked me if I was still using the same template that I was using like 3 months ago and I said "Yes" which is true, BUT I later realized that I had added another ...
Trading Made Simple(r)
- RobinHood replied Jan 29, 2023
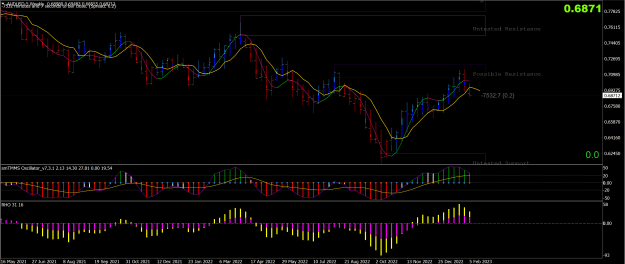
Regarding the Forex, these days I am just day trading the AUDUSD and the GBPJPY. Any more than that and I lose my focus. Yes, still the RHO template BUT... It would be more correct to say in the two lower windows, I have the smTMMS v7.3.1 in one ...
Trading Made Simple(r)
- RobinHood replied Jan 25, 2023
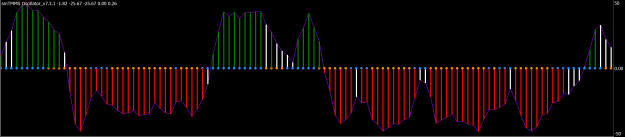
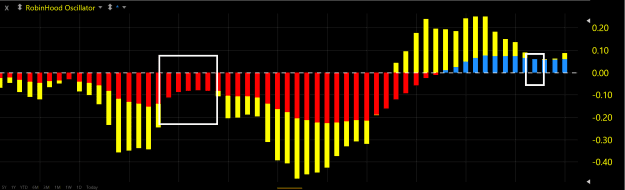
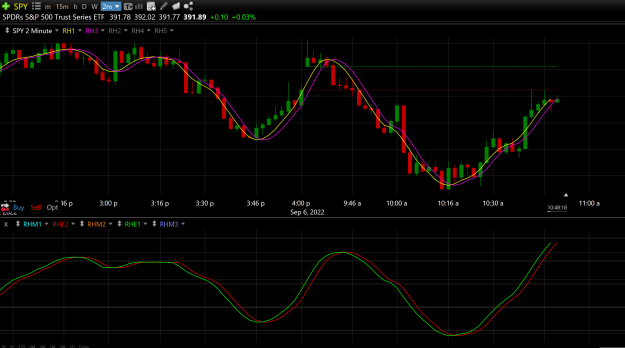
I want to mention another way to use the RobinHood Oscillator that is quite easy to see... Look at bars in the image below and focus on the square white boxes. Notice that when there is a down trend and both colors of the RHO are visible, then ...
Trading Made Simple(r)
- RobinHood replied Nov 2, 2022
Well, I think that was a pretty ingenious way to plot the VS. Thanks for posting it. I changed the 4 ema to 7 ema as it smooths things out a bit better. But it's always a game of "give and take" with the VS when you change length of the ema. image
Six Months Project
- RobinHood replied Oct 24, 2022
Yeah, it looks good. What is the Magenta/Yellow Line?? I am using the 20 sma with this set up BECAUSE that's what most stock traders use instead of ema's, but I doubt it really makes too much difference considering that we are using the "area" of ...
Six Months Project
- RobinHood replied Oct 18, 2022
I wondered how your trades are generally split between daily and weekly chart trades? I don't ever initiate my trades based ONLY on a Weekly chart. I initiate my trades from a Daily chart, I just make sure that the Weekly chart's indicators are ...
Trading Made Simple(r)
- RobinHood replied Sep 5, 2022
I agree with everything you said. It looks like you did very well with your test, so congratulations on that!
Six Months Project Here's the indicator (in the lower window) that I was telling you about. image
- RobinHood replied Jul 13, 2022
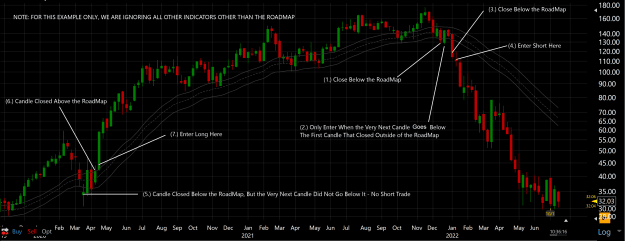
As I have said several times, I never enter a trade when Price is inside the RoadMap, but I do have a very hard and fast rule as to exactly how I enter a trade once there is a Close outside of the RoapMap. In the image below and just for this ...
Trading Made Simple(r)
- RobinHood replied Jul 2, 2022
So as I mentioned yesterday, I just got back from a 7 day Caribbean cruise. I left on Friday, June 24, 2022 from Cape Liberty, NJ. The following Tuesday, I woke up with a very slight sore throat, and the same thing happened on Wednesday. Then on ...
Trading Made Simple(r)