- Search Crypto Craft
- 35 Results
- skillz16 replied Sep 24, 2021
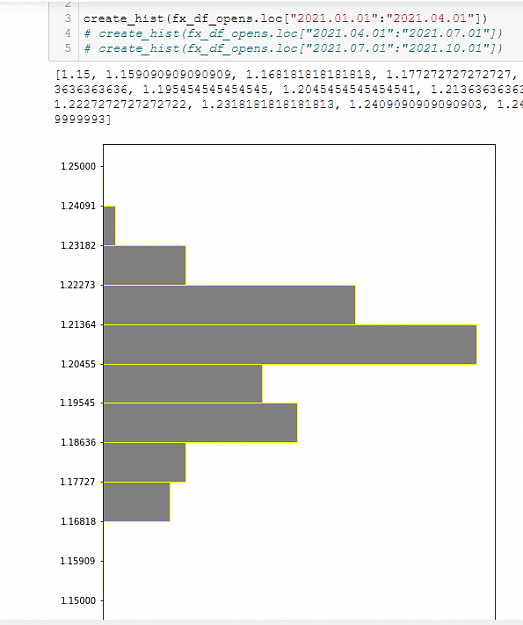
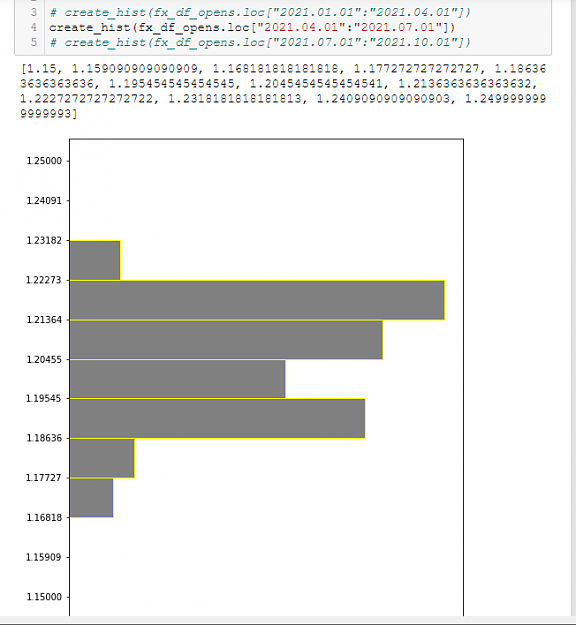
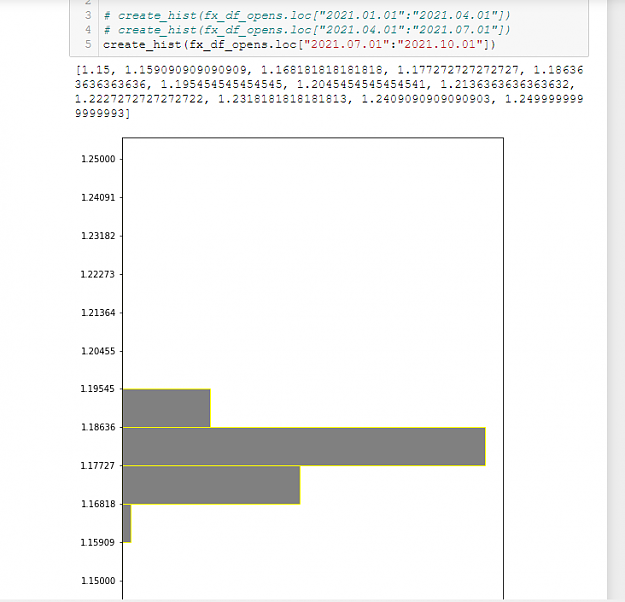
Looks consolidating to go upward to me. Estimates put the EURUSD at 1.19 to 1.20ish (And GBPUSD unrelated at 1.39-1.40). They have been saying that for the past few quarters now though, and hit that in previous: Q1 (Jan-Mar) deciles trading (data ...
EURUSD only

- skillz16 replied Sep 5, 2019
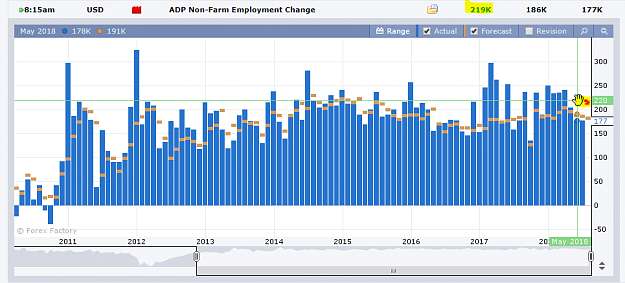
Is this fake news...?: url
EURUSD only image I feel like I've seen this come out as a really weak number before indicating USD fall, only to see the 8:15 EST one then be really high... image


- skillz16 replied Jul 19, 2019
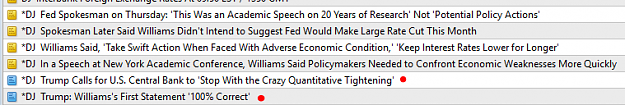
Fed: We need to "cut rates" without actually cutting rates so that we can preserve policy room! Fed's Williams: we must be prepared to act rapidly in cases of trouble. Market: let's sell off the dollar and loosen conditions. Fed's Williams (after ...
EURUSD only
- skillz16 replied Jul 18, 2019
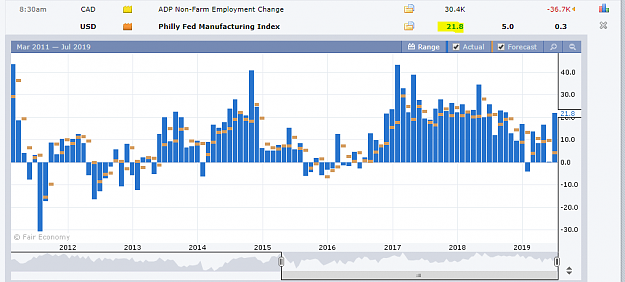
What the heck was up with that strong Philly Fed number? image Think this keeps it flat to down for the day unfortunately. I will stay in my long and stay suffering while waiting for the move.
EURUSD only
- skillz16 replied May 16, 2019
Ha, time for the algos to read "China"... "Sell".. and "US Treasuries".. and cause a flash-crash US Rate spike up, and EUR/USD plummet.
EURUSD only image
image

- skillz16 replied Apr 26, 2019
Does anyone here know what the difference is between "GDP" and "GDP Price"? image
EURUSD only

- skillz16 replied Feb 27, 2019
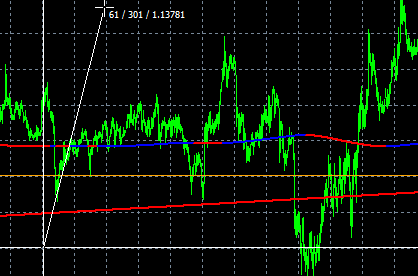
I'm referring to this (screenshot) of the range for the past few days (before yesterday). it is 0.003 difference: from 1.13480 to 1.13780. Is this 300 pips?: My friends and I always talk in items like 0.01 and 0.003 since that is honestly easier to ...
EURUSD only

- skillz16 replied Feb 14, 2019
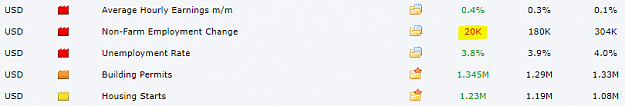
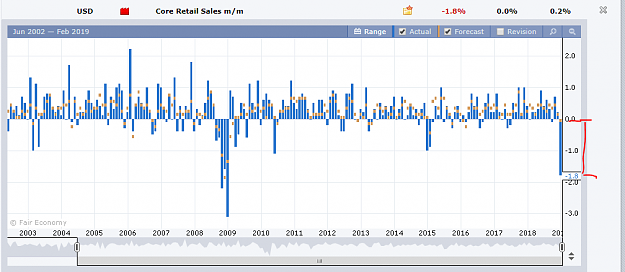
Holy heck, they were off really far... Only looked this bad in '09. WOAH! Actual vs Expected difference for most of these is YUGE!: image
EURUSD only

- skillz16 replied Aug 1, 2018
Woah, low US data here now... I'd expect to see the price re-take 1.1683 here soon but who knows.
EURUSD only I'm actually long part of my position for later at 1.1676 because that was part of my plan.

- skillz16 replied Aug 1, 2018
It is not a big move up. So this doesn't even count as an up move in my book. Are you really playing for 0.002? Really? If you think it is overvalued by your system, wait for the ISM news and see if you can catch some downside then. Does this look ...
EURUSD only
- skillz16 replied Aug 1, 2018
Daily is on a DOJI now with EST close bars. When it moves from there, usually fast. My overall bias is up but I'm waiting until more toward during/after the FED meeting to buy. And I'm trying to see if I can get a great price now or then (now if it ...
EURUSD only
- skillz16 replied Jul 31, 2018
Second part: do you really think you can out-think noise from the market? IE most people set their stops waaayyyyy too close to the market. You have no clue what that order book looks like or how filled or sparse it is or how quickly (or even how) ...
EURUSD only
- skillz16 replied Jul 25, 2018
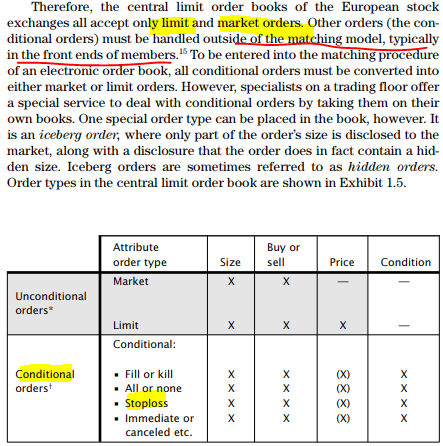
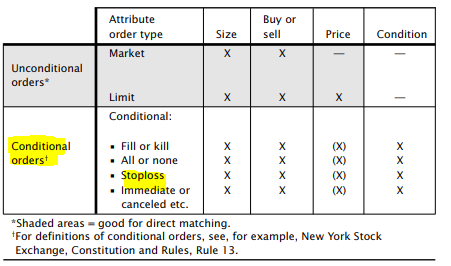
Just a point for the no stop loss part: this is from the NYSE and "Equity Markets In Action" book, but still applies to FX: notice how Stoploss is listed as conditional? Here is a summary of what that means: IE the actual market only takes Market ...
All Majors Only- No stop group
- skillz16 replied Jul 18, 2018
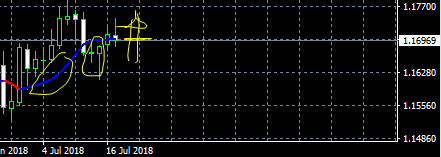
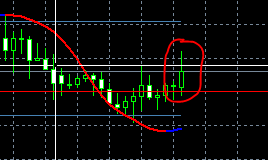
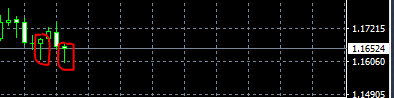
If this stands to the 5EST close (about 3 hours), this is ANOTHER heavy up candle here now... right? These two circled on the DAILY make it look pretty bullish - those long tails man, right? Who is with me? Lookos like accumulation from ~ 1.16320 to ...
EURUSD only
- skillz16 replied Jul 17, 2018
Yeah, I'm really confused. Really REALLY confused.
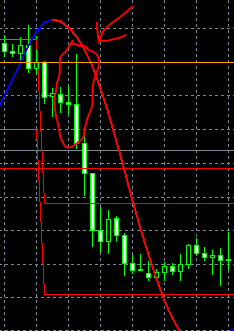
EURUSD only Daily chart, normally above the blue is LONG, Open below is starting to get short. We had a rejection of it going lower on the circled bar and it is a really strong ...