- Search Crypto Craft
- 591 Results (17 Threads , 574 Replies )
-
 simnz replied Apr 11, 2022
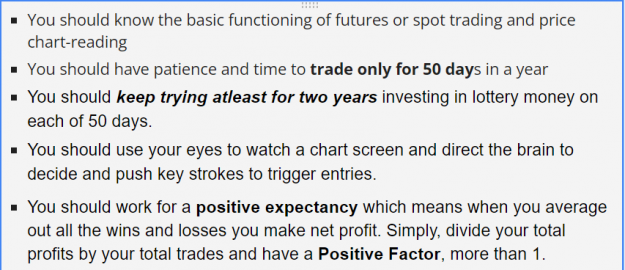
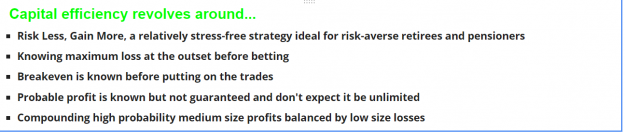
I train risk-averse retirees for generating passive income from trading of futures. They have limited expectations. That is of having a fixed income on a weekly basis. Most of them have lost money trading stock options as a seller. You won't find ...
Emotions and Mindfulness: what is your approach?
- simnz replied Apr 6, 2022
Pre-FOMC Minutes release, the consolidation lasted for 6.5 hours prior to the release time. The Range was 50 HL pips for the consolidation during which buys and sells were recorded . The consolidation period prior to major data release lasts from 16 ...
Statistics based system; Technical Documentation
- simnz replied Apr 6, 2022
If you can find a pattern of hugging or hippo-jumping Consolidation measured by time, major news event, Thursday and Fridays (weekly options expiration days), quarterly triple/quadruple wrenching dates, we can derive useful insights. Presently, as a ...
Statistics based system; Technical Documentation
- simnz replied Apr 5, 2022
You may find these two indicators relevant for your thread.
moodybot's most volatile EU/GU/XAU/BTC trading
- simnz replied Apr 3, 2022
The way financial markets and prices of financial assets move often follows a certain rhythm and very specific rules. Furthermore, depending on the time of day and the general market environment, the way prices move can change significantly with ...
Mind and Machine Scalping system for risk-averse retirees
- simnz replied Apr 1, 2022
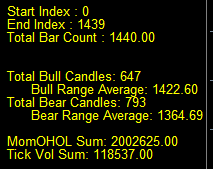
The MT4 Indicator that generates csv/Excel spreadsheet uses the following terminology and the concept Concept: High/Low values may fluctuate depending on the time zone, they are more meaningful as they show actual mathematical maximum or minimum for ...
Mind and Machine Scalping system for risk-averse retirees

- simnz replied Apr 1, 2022
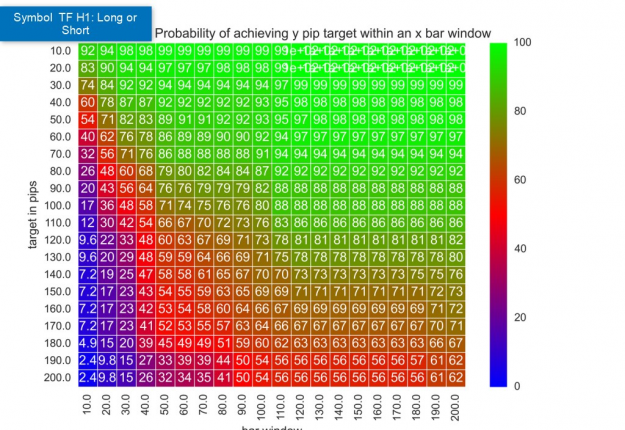
You got it right. The machine is needed to capture the surges which a naked eye could not discern it easily. But the surges for me are a major source of income. The BR stats indicator shows 1440 minutes churning more than 99 times of the daily range ...
Mind and Machine Scalping system for risk-averse retirees
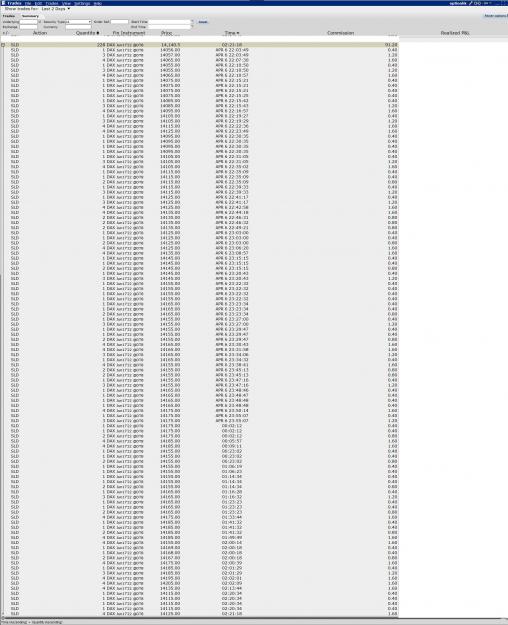
- simnz replied Apr 1, 2022
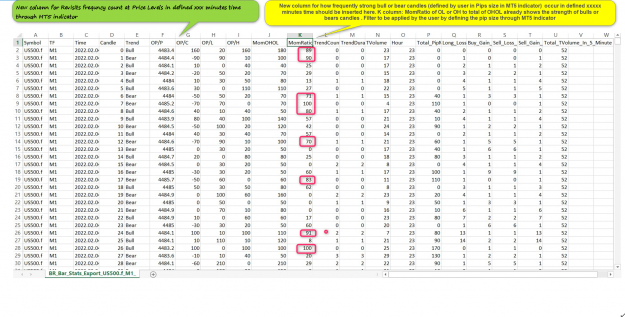
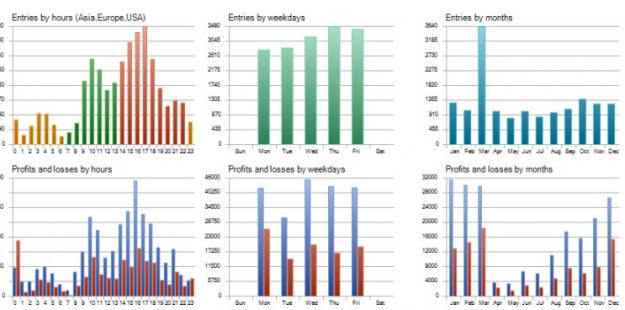
This is the spreadsheet being generated presently. The indicator generates raw data. If you can manipulate the data and generate statistics that will be great. In which case only the modified spreadsheets generates reports. Examples of useful visual ...
Mind and Machine Scalping system for risk-averse retirees
- simnz replied Apr 1, 2022
If you can use your Excel expertise to create user-friendly visuals like this, that would be very helpful. Statistics for me are useful when I am able to find them for actionable use in trading. image Volatility for each symbol. No income can be ...
Mind and Machine Scalping system for risk-averse retirees
- simnz replied Apr 1, 2022
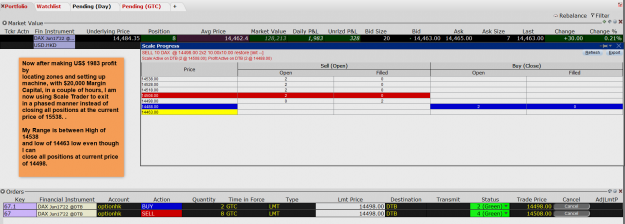
Exiting by Scaling out!
Mind and Machine Scalping system for risk-averse retirees
- simnz replied Apr 1, 2022
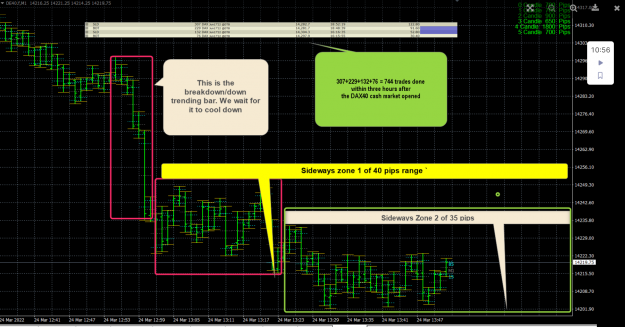
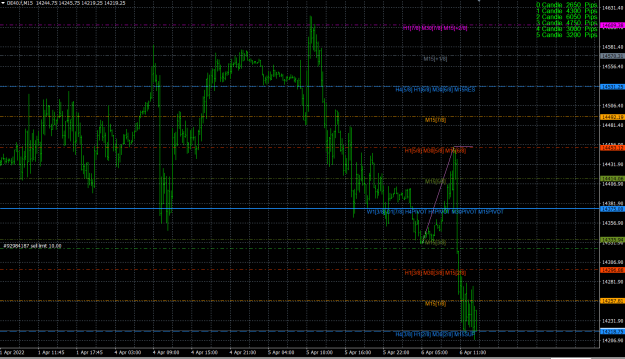
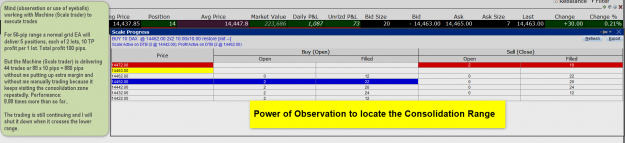
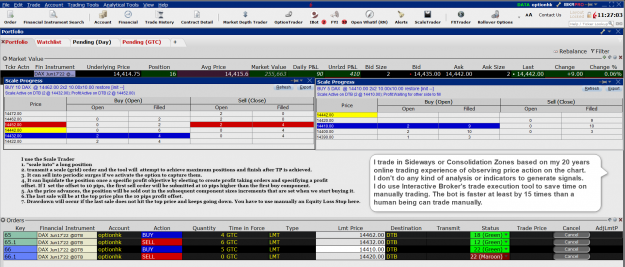
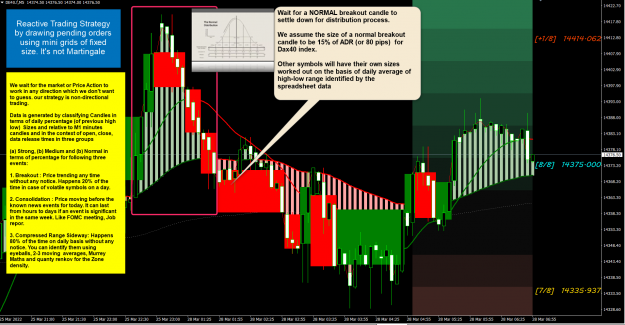
The Power of Observation (using eyeballs and the brain) to locate Consolidation Zones with High Low range of 50 or 60 pips and the trader becoming a machine operator to start the trades execution tool. Manual trading or posting Pending Orders is not ...
Mind and Machine Scalping system for risk-averse retirees
- simnz replied Mar 31, 2022
NT means what? Is it a software or trading platform? How different is it from Excel ? By the way, are you referring to Ninja Trader? I also use Ninja Trader, MT4 and MT5 for analysing trades and designing trading system and ideas. With no Excel or ...
Mind and Machine Scalping system for risk-averse retirees
- simnz replied Mar 31, 2022
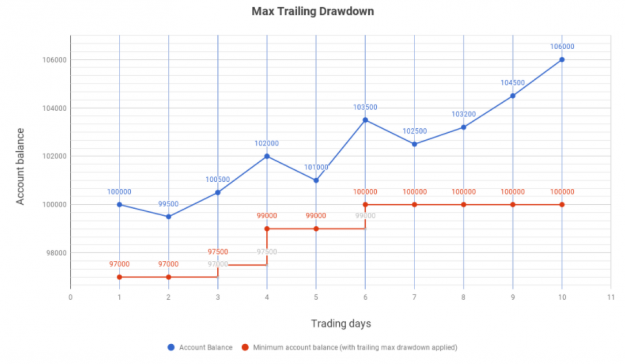
What is trailing Drawdown? How does the Max Drawdown work? image It is a good trading practice to use the maximum DD is of the “trailing” type that is calculated on the top of the equity. Example: Starting balance of $ 10,000 means that at $9,600 ...
Mind and Machine Scalping system for risk-averse retirees
- simnz replied Mar 31, 2022
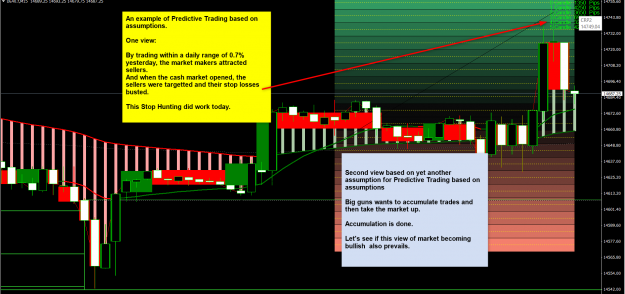
Two different views derived from Assumptions
Mind and Machine Scalping system for risk-averse retirees
- simnz replied Mar 31, 2022
Scaling up and Down using an auto trading utility Look for an auto trading trades execution tool which works continuously when the consolidation happens even when you are increasing or decreasing trades Use execution bot or utility to scale traders ...
Mind and Machine Scalping system for risk-averse retirees
- simnz replied Mar 30, 2022
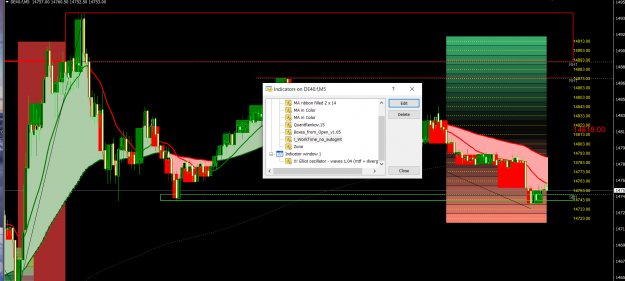
I have added another indicator which can help observe Strong Zones of Resistance and Support based on previous price movements. The sole objective is to help Chart Observation rather than getting dependent upon the indicators to give signals. ...
Mind and Machine Scalping system for risk-averse retirees
- simnz replied Mar 27, 2022
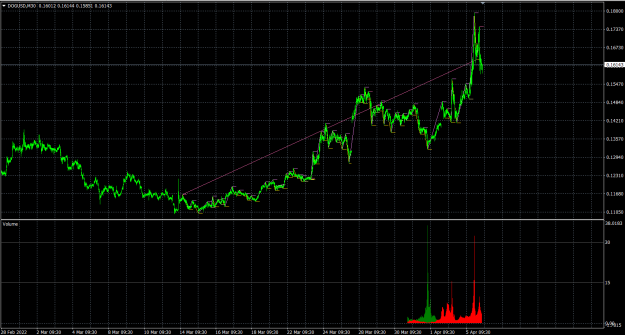
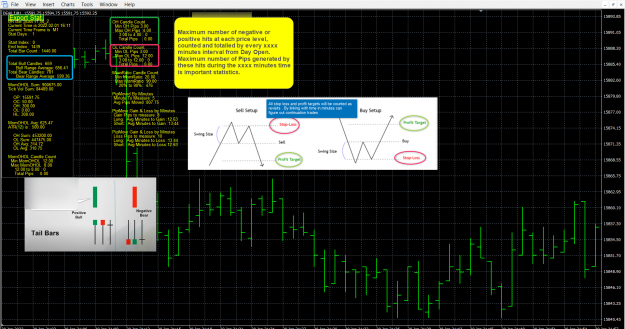
I think you were trading martingale. You were using multiplying of lots. I never use martingale . Only constant size lots. My strategy is simple. image 1. I have given enough information to make data sets for logging the frequency of breakouts and ...
Mind and Machine Scalping system for risk-averse retirees
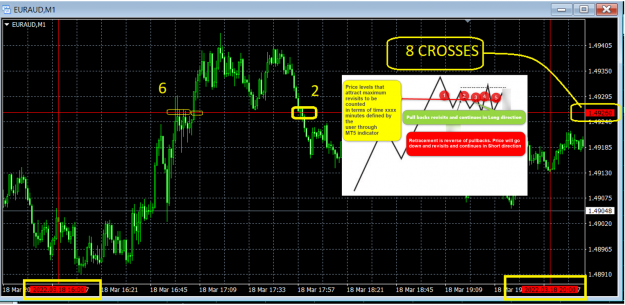
- simnz replied Mar 25, 2022
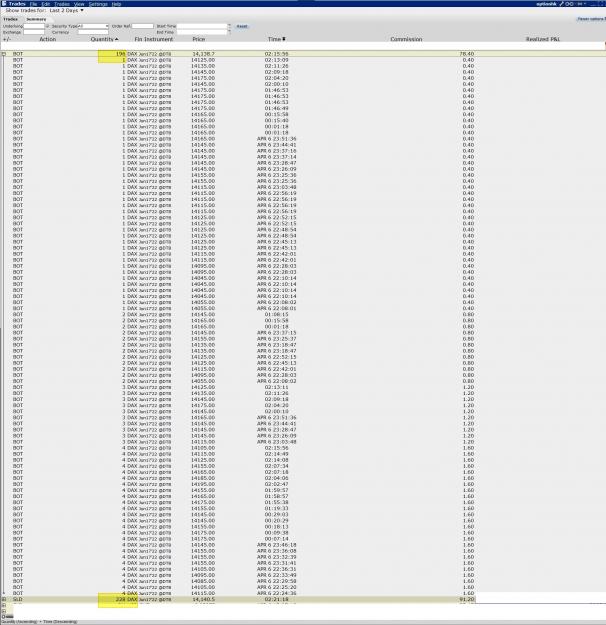
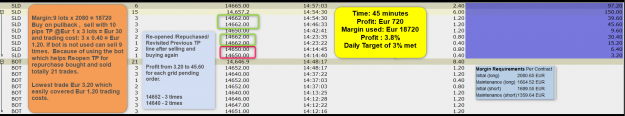
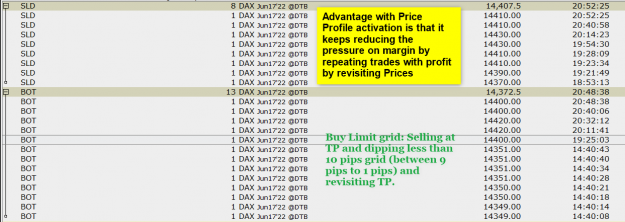
The beauty of Price Crossings is that it helps increase margin equity with fewer trades See today's Price Profile in action
Comprehensive Technical Analysis expert Mahal
- simnz replied Mar 25, 2022
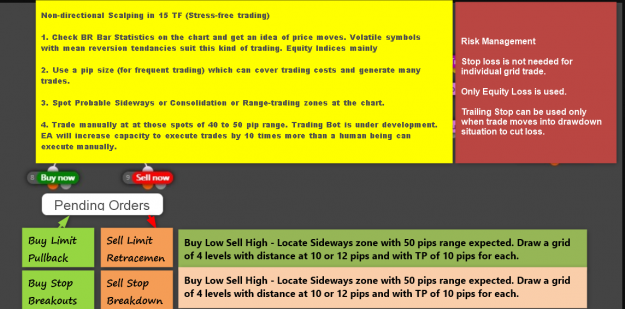
In a picture: Stress-free trading for risk-averse investors like Retirees
Mind and Machine Scalping system for risk-averse retirees
- simnz replied Mar 25, 2022
Equity indices I can suggest is DAX40, S&P500 from my own experience. Price profile works well only if the price crosses a TP by at least 5 points to 9 points in a grid distance of 10 pips. Example: For a 40 pips range of 10 pips distance of ...
Comprehensive Technical Analysis expert Mahal